
Back-to-School Reshaped Amazon in July 2026: The Subcategories That Surged
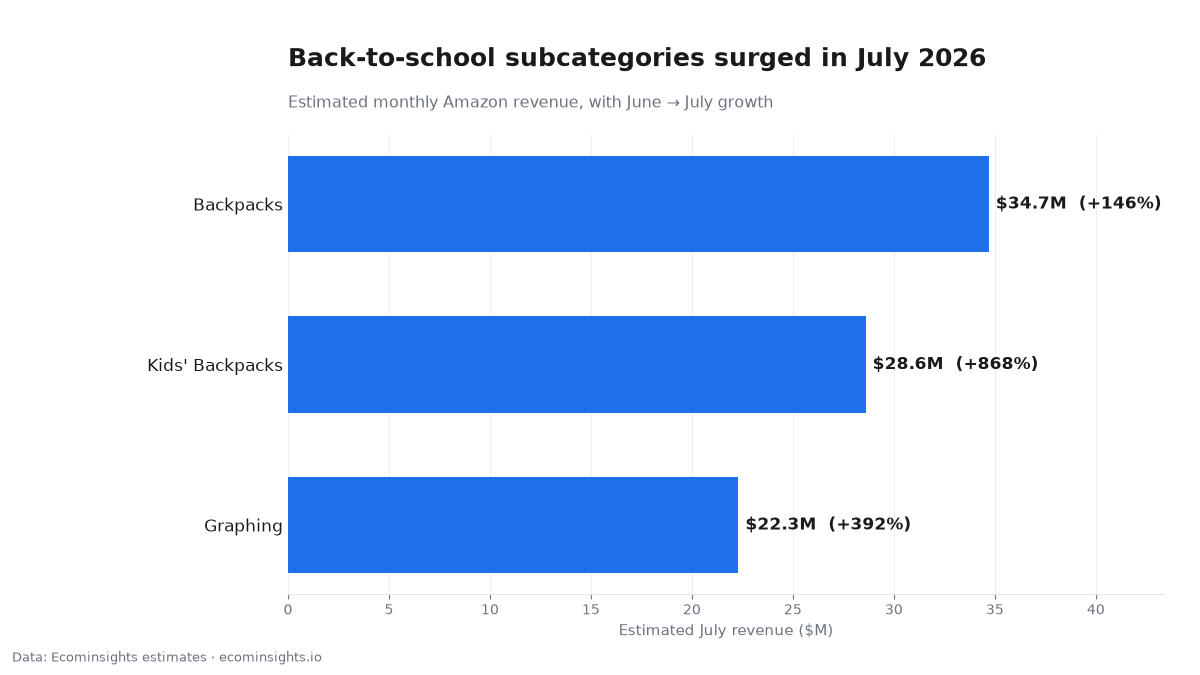
In July 2026, back-to-school demand moved real money on Amazon: backpacks, kids’ backpacks, and graphing calculators all posted their biggest month of the year, with backpacks alone nearly tripling from an estimated $14.1M to $34.7M. Comparing June to July, Ecominsights estimates show each subcategory’s monthly revenue rising far ahead of the marketplace as a whole. The pattern is a textbook case of seasonal demand, and a practical lesson in how to plan inventory, pricing, and ad spend around a demand window you can see coming a year in advance. Below is the full picture, a read of what drove each surge, how to tell seasonal spikes from real growth, and what an operator should actually do about it. All figures below are Ecominsights estimates from observed marketplace signals, comparing June to July 2026.
Key takeaways
- Backpacks nearly tripled month-over-month, from an estimated $14.1M to $34.7M (+146%).
- Kids’ Backpacks posted the sharpest spike, from an estimated $3.0M to $28.6M (+868%).
- Graphing calculators rose from an estimated $4.5M to $22.3M (+392%), a dependable July winner.
- The pattern is seasonal, not structural: the lift lines up precisely with the back-to-school window.
- All figures are Ecominsights estimates, not official Amazon numbers.
The data at a glance
| Subcategory | Est. revenue (June → July) | Change |
|---|---|---|
| Backpacks | $14.1M → $34.7M | +146% |
| Kids’ Backpacks | $3.0M → $28.6M | +868% |
| Graphing calculators | $4.5M → $22.3M | +392% |
Why subcategory data beats a single product here
Watching one backpack tells you about one listing; watching the Backpacks subcategory tells you the entire school-bag market roughly tripled in a month. That’s a more valuable signal, because a surging subcategory lifts demand (and ad costs) for everyone in it, from the category leader to the smallest seller. It also tells you the surge is real rather than a single seller’s fluke: when a whole subcategory moves together on a large base, you’re watching genuine consumer behavior, not one listing’s promotion. For planning, the subcategory is the right altitude: it’s where you decide whether to be in stock and bidding, regardless of which specific SKU you sell.
Backpacks: the clearest signal
Backpacks went from an estimated $14.1M in June to $34.7M in July, a +146% jump on an already-large base. That last detail is what makes it credible: when a subcategory this big more than doubles in a month, it’s demand, not noise. Families buying for the school year drive a broad, catalog-wide lift across hundreds of listings rather than a spike in one. For anyone selling bags, or adjacent products like lunch boxes, pencil cases, or water bottles that go in the same cart, this is the anchor signal of the season: the month the category’s demand and competition both peak, and the month your listing has to already be positioned to catch it.
Kids’ Backpacks: the sharpest spike
Kids’ Backpacks rose from an estimated $3.0M to $28.6M, an +868% jump, by far the steepest on the list. That near-tenfold curve is typical of a tightly seasonal segment: quiet for much of the year, then a hard, concentrated spike in the buying window. The very large percentage is partly a function of the small June base: when a category is nearly dormant most of the year, its seasonal peak looks enormous in percentage terms. That doesn’t make the demand less real (the July level of an estimated $28.6M is substantial), but it does mean the headline percentage is amplified by how low the off-season floor is. It’s the purest seasonal-buy pattern in the data.
Graphing calculators: the reliable July winner
The Graphing subcategory (led by the Texas Instruments TI-84 line) grew from an estimated $4.5M to $22.3M, a +392% jump and one of the most dependable back-to-school signals on Amazon. Graphing calculators are bought on a calendar: required for specific math courses, purchased right before the school year, and barely touched as a category the rest of the time. That predictability is the operator’s friend: a category this reliable lets you plan with confidence, because the demand arrives on schedule year after year. Where kids’ backpacks are a spike and adult backpacks a broad lift, calculators are the clockwork buy you can practically set inventory to.
Why the three percentages differ so much
The three subcategories rose +146%, +868%, and +392%, and the spread is itself instructive. The difference isn’t that one is “better”; it’s about base size and how seasonal each category is year-round. Backpacks have a large, steady off-season base (people buy bags all year), so even a big absolute surge is “only” +146%. Kids’ backpacks and calculators are near-dormant outside the school window, so their small June bases make the same kind of seasonal peak look far larger in percentage terms. When you read seasonal data, always weigh the percentage against the base: a huge percentage off a tiny base and a moderate percentage off a large base can represent similar real demand.
Seasonal vs. structural: how to tell the difference
Everything here is seasonal, and knowing that is the point. It’s not a lasting shift in the market, it’s the calendar. The way to confirm seasonality rather than assume it is to compare each subcategory to the same month last year: a category that spikes every July and subsides every fall is seasonal and should be planned on that cycle, while one climbing above its own prior-July level is genuinely growing. Treating a predictable seasonal peak as a permanent trend is the single most common way operators over-order and then get stuck holding inventory through the off-season. These three will almost certainly give back most of the gain in the fall. That’s expected, not a warning sign. The mistake is reading July’s $34.7M in backpacks as a new run-rate and stocking accordingly; the honest read is that it’s a peak the category returns to roughly this time every year, and planning against it means planning for both the surge and the drop that follows.
What operators can take from this
If you sell anything school-adjacent, July is not the month to test. It’s the month to be in stock, priced, and winning the buy box. The demand curve does the work; the question is whether your listing is positioned to catch it. That means your inventory and pricing decisions belong in late spring and early summer, before the surge, not in the middle of it when competitors have already bid impressions up and the fastest-moving stock is gone. Expect these subcategories to give the gains back in the fall, so plan inventory around the window, not the peak. The goal is to sell through cleanly, not to be the seller left with school bags in October.
How to plan inventory around a seasonal window
Use last year’s monthly shape to build this year’s plan. Pull the subcategory’s 12-month history, mark when demand starts building and when it peaks, and back-schedule: inventory landed and listings optimized before the ramp, ad budget raised into the build-up, and a wind-down plan so you’re not overstocked when the window closes. Size your order to the volume you can realistically sell through the window, not to the peak month projected forward, which is how sellers end up with dead stock. For tightly seasonal segments like kids’ backpacks and calculators, this discipline is everything, because the off-season demand won’t bail you out of an over-order the way a steady category might.
Adjacent opportunities a seasonal surge creates
A back-to-school surge doesn’t stop at backpacks and calculators. It pulls a whole basket of related products along with it: lunch boxes, water bottles, notebooks, pens, dorm supplies, and classroom cleaning goods (which is exactly why price cuts on back-to-school cleaning wipes worked the same month). If you can’t compete head-on in a crowded core category like backpacks, the adjacent, lower-competition products riding the same wave may be the better play. The discipline is to ask, whenever you spot a seasonal surge: what else is in this shopper’s cart, and is there a less-contested listing where I can capture part of the same demand? Category data points you to the wave; creativity about adjacencies is how a smaller seller rides it.
How to track your own seasonal category
Make it routine well before the season. Pull your subcategory’s total estimated revenue for the last twelve months, note the shape (when it builds, peaks, and fades), and compare this year’s trajectory to last year’s to confirm the pattern is holding. Watch adjacent subcategories that move with yours. Those correlations flag the full basket of seasonal demand. Each cycle, decide one thing: be in stock and bidding for the window, or sit it out. Over a couple of years you’ll have a reliable seasonal playbook for your niche, which turns a predictable surge from a scramble into a planned, profitable window.
What to do next
Identify your most seasonal subcategory and pull its 12-month estimated revenue. Mark the build-up and the peak, compare to last year to confirm the pattern, and back-schedule inventory and ad spend to be ready before the ramp, sized to sell through the window. Do this a season ahead and the surge becomes a planned, profitable window instead of a scramble you react to once competitors have already bid up the category. You can track any subcategory’s monthly trend, with a full year of history to confirm the seasonal shape, on Ecominsights, free to start.
FAQ
Are these official Amazon sales numbers? No. They’re Ecominsights estimates from observed marketplace signals, comparing June to July 2026, aggregated by subcategory.
Is this growth permanent? No, it’s seasonal. These subcategories spike in the summer back-to-school window and cool afterward. Compare to last year’s same month to confirm the pattern.
Why is Kids’ Backpacks’ +868% so much bigger than Backpacks’ +146%? Base size: kids’ backpacks are near-dormant most of the year, so a small June base makes the seasonal peak look huge in percentage terms, while all-year backpack demand gives a larger, steadier base.
When should I order inventory for a seasonal category? In late spring/early summer, before the ramp, sized to what you can sell through the window, not to the peak month projected forward.
What if I can’t compete in backpacks directly? Look at adjacent products riding the same wave (lunch boxes, water bottles, supplies), which are often less contested than the core category and ride the same shopper into the same cart during the same window.
How can I track a subcategory’s trend myself? You can see how any category, product, or brand has trended month over month on Ecominsights, free to start, with 12 months of history.
Methodology: Ecominsights estimates from observed marketplace signals, comparing June and July 2026. Estimates, not official figures. Last updated: September 2026.
Data: Ecominsights, Amazon market intelligence on 5M+ products. Ecominsights.
We deliver the most actionable insights for Amazon sellers, brands, agencies, and investors; revealing hidden opportunities, competitor weaknesses, and the data that actually moves revenue. Make every decision backed by real marketplace signals, not assumptions.
No credit card required • Get set up in under 2 minutes
⭐⭐⭐⭐⭐ Trusted by 2,000+ Sellers