
The Household Brands That Grew Most on Amazon in July 2026
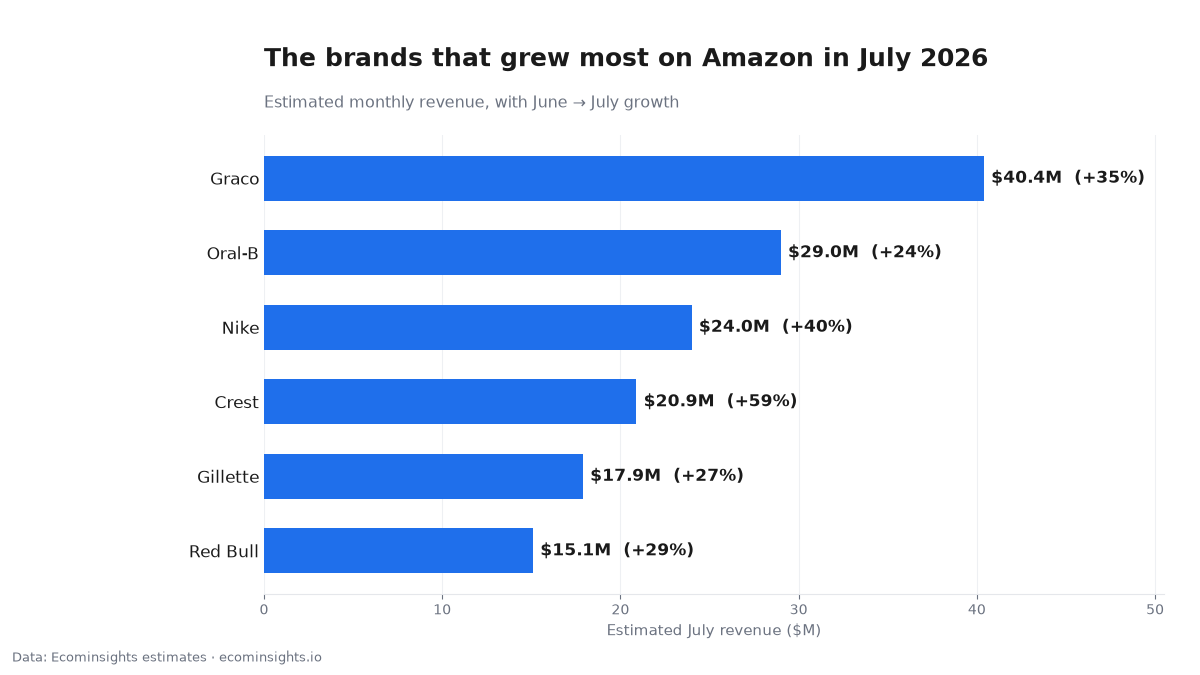
In July 2026, several of Amazon’s largest household brands added millions in monthly revenue, led by Graco (an estimated $29.9M → $40.4M), Nike (+40%), and Crest (+59%). These are established names growing on already-large bases, which makes the movement signal rather than noise: a big brand adding a third to its revenue in a month reflects real demand, not a data artifact or one lucky SKU. Below is the full breakdown, a per-brand read of what likely drove each move, the difference between seasonality and genuine momentum, and how to use big-brand movement as a competitive-intelligence signal even if you don’t sell against these names directly. All figures are Ecominsights estimates from observed marketplace signals, aggregated across each brand’s tracked products and comparing June to July 2026.
Key takeaways
- Graco led in absolute terms: an estimated $29.9M → $40.4M (+35%), roughly a $10M monthly swing.
- Nike grew fastest among the giants at +40% ($17.1M → $24.0M) across 1,578 tracked listings, a back-to-school signal.
- Crest posted the largest percentage move (+59%), and with Oral-B and Gillette formed a rising oral-care/grooming cluster.
- Red Bull’s +29% is textbook summer seasonality, not a strategy story.
- All figures are Ecominsights estimates, not official brand numbers.
The data at a glance
| Brand | Est. revenue (June → July) | Change | Tracked ASINs |
|---|---|---|---|
| Graco | $29.9M → $40.4M | +35% | 289 |
| Oral-B | $23.5M → $29.0M | +24% | 263 |
| Nike | $17.1M → $24.0M | +40% | 1,578 |
| Gillette | $14.0M → $17.9M | +27% | 159 |
| Crest | $13.1M → $20.9M | +59% | 159 |
| Red Bull | $11.6M → $15.1M | +29% | 91 |
Graco: the biggest absolute mover
Graco grew from an estimated $29.9M to $40.4M, roughly a $10M swing in a single month across 289 tracked ASINs. On a base that large, a 35% lift represents a substantial amount of real demand, not a rounding artifact or a single hot SKU going viral. Baby gear is a quietly enormous Amazon category, driven by a constant flow of new parents who research heavily and buy in clusters (car seat, stroller, and accessories together). A move of this size across nearly 300 listings suggests broad catalog strength rather than one product, which is what makes it credible. For anyone selling adjacent baby or nursery products, it’s a clear signal that the category pulled in demand, and ad competition, during the month, and that August budgets in the space should assume elevated CPCs.
Nike: back-to-school in the numbers
Nike rose an estimated 40% ($17.1M → $24.0M) across 1,578 listings, by far the widest catalog in this group. The timing lines up with the back-to-school apparel-and-footwear window, when parents and students buy shoes and basics ahead of the school year. The breadth matters: with 1,578 ASINs moving rather than a handful, this reads as seasonal category demand lifting the entire line, not a single sneaker drop. That’s the kind of predictable, calendar-driven surge worth planning inventory and ad budget around a month ahead. If you sell in footwear or activewear, the lesson is to have stock and bids in place by early July, not to react in August once the wave has already crested.
Oral-B, Crest, and Gillette: the staples restocked together
Three consumer-staple brands moved in the same direction in the same month: Oral-B ($23.5M → $29.0M, +24%), Crest ($13.1M → $20.9M, +59%), and Gillette ($14.0M → $17.9M, +27%). When a cluster of replenishment brands rises together, it usually reflects promotional timing and restock cycles rather than any one product breaking out. Crest’s +59% is the standout of the trio and the single largest percentage move on the list, which points to a heavier promotional push or a subscribe-and-save cycle landing in July. Oral care and grooming are habitual, repeat-purchase categories, so coordinated lifts here tend to be about deals and Prime-adjacent events pulling forward routine buying. For operators in these categories, this is the clearest “rising tide” in the dataset, and a reminder that promotional calendars, not virality, drive most staple-goods swings.
Red Bull: summer seasonality, on schedule
Red Bull’s estimated +29% ($11.6M → $15.1M across 91 listings) is textbook seasonality: energy-drink demand peaks in summer, and the data reflects it right on cue. It’s a useful reminder that not every big move is a story about strategy or execution; some are simply the calendar doing what it does every year. The skill is telling the two apart, and a narrow catalog (just 91 ASINs) concentrated in a strongly seasonal category is a tell that you’re looking at seasonality rather than a durable shift. If you benchmark against a brand like this, compare July to last July, not to June.
Seasonality vs. momentum: how to tell them apart
The most common mistake with month-over-month data is treating a seasonal bump as a trend. Three checks separate the two. First, look at catalog breadth: broad, multi-ASIN growth (Nike, Graco) is more likely to be real category demand than a narrow spike. Second, check the category around the brand: if the whole category rose, the brand is riding a tide; if only the brand rose, something brand-specific is working. Third, compare to the same month last year: a brand that jumps every July is seasonal, while one climbing above its own prior-July level is gaining share. Red Bull fails the second and third tests (seasonal); Crest’s outsized move within a rising cluster looks promotional. Applying these checks keeps you from building a strategy on a calendar effect.
Why big-brand movement matters even if you don’t compete with them
Watching brands like these is competitive intelligence, not spectator sport. When the giants in a category all grow in the same month, it tells you where consumer demand (and therefore ad spend) is concentrating. That has two immediate consequences for smaller sellers: impressions in those categories get more expensive as big budgets pile in, and the buy box gets more contested. Knowing which categories are heating up lets you decide where to lean in and where to conserve budget before your own ACoS report tells you the hard way. A giant’s surge is an early-warning system for the whole category’s ad market.
How to read brand-level revenue (and why big bases are reliable)
Large bases are the most trustworthy signal in month-over-month data. A tiny brand jumping 300% often reflects a measurement quirk, a restock after a stockout, or a single review going viral; a $20M brand growing 30% almost certainly reflects genuine demand, because idiosyncratic noise averages out across a big catalog. That is exactly why this list is ranked by size and moderate growth rather than by the largest percentage: the goal is signal you can act on, not a leaderboard of statistical flukes. When you run this on your own category, resist the urge to feature the biggest-percentage mover; feature the biggest brand with a clean, broad-based move.
Building a brand watchlist for your category
Turn this into a repeatable habit. Pick the top 10–15 brands in your category and pull their monthly estimated revenue for the last 12 months. Each month, scan for two things: clusters moving together (a demand signal for the whole category) and any single brand breaking away from the pack (a share-shift worth studying). Tag each move as seasonal, promotional, or structural using the three checks above. Over a few months you’ll have a living map of where demand and ad pressure are heading in your niche, the same map these six brands would show you for household goods, applied to the categories you actually sell in.
A worked example: sizing the opportunity next to a giant
Suppose you sell baby bottles and Graco-adjacent nursery accessories. Graco’s estimated $10M July swing doesn’t mean you’ll capture a slice of it directly, but it does size the wave you’re paddling in. If the category leader added roughly a third to its revenue on broad, multi-ASIN strength, the demand curve for the whole baby-gear category almost certainly rose with it, more shoppers browsing, more add-to-carts, more competition for the same sponsored slots. The practical move is to model your own July against that backdrop: if your revenue was flat while the category leader jumped 35%, you likely lost share or ran out of inventory at the wrong moment. If you grew alongside it, you rode the tide competently. Either way, the giant’s number gives you a benchmark your own dashboard can’t provide in isolation.
The limits of these estimates, and how to use them anyway
These are estimates, not audited figures, and they’re most reliable for direction and relative size rather than to-the-dollar precision. A single month can be distorted by a stockout, a lightning deal, or a listing merge, which is why the trajectory and the breadth (ASIN count) matter more than any one data point. Use the numbers to answer directional questions (is this brand growing, is the category heating up, is a move broad or narrow) and treat the dollar figures as informed approximations, framed as “our data suggests,” not as the brand’s books. Read that way, month-over-month estimates are a genuinely useful early-warning and benchmarking tool; read as gospel, they’ll occasionally mislead. The discipline is knowing which questions they answer well.
What to do next
If you compete in baby gear, oral care, grooming, or apparel, July was an expanding pie. Confirm your inventory and ad coverage caught it and set August budgets to match. If you sell elsewhere, build the watchlist above for your own category and start tagging moves this month. You can track any brand’s monthly estimated revenue, with 12 months of history, on Ecominsights, free to start.
FAQ
Are these official brand sales figures? No. They’re Ecominsights estimates from observed marketplace signals, aggregated across each brand’s tracked products, June to July 2026.
Why rank by revenue instead of percentage growth? Large bases make the signal reliable; the biggest-percentage movers are usually small brands where the number is mostly noise.
How much of this is seasonality? A meaningful share, Nike (back-to-school) and Red Bull (summer) especially. Comparing to the same month last year is how you separate seasonality from real momentum.
Can I see this for my own category? Yes: brand-level revenue with 12 months of history for any category, so you can build a watchlist like the one above.
Does big-brand growth affect small sellers? Yes. It raises ad costs and buy-box competition across the category, so it’s worth watching as an early cost signal.
What does the ASIN count tell me? Breadth: growth spread across many ASINs (like Nike’s 1,578) is more likely real category demand than a narrow, possibly seasonal spike.
How current is the data? It’s refreshed monthly across 5M+ products; this analysis covers the June→July 2026 period.
Methodology: Ecominsights estimates from observed marketplace signals; brand figures aggregate a brand’s tracked products, comparing June and July 2026. Estimates, not official figures. Last updated: September 2026.
Data: Ecominsights, Amazon market intelligence on 5M+ products. Ecominsights.
We deliver the most actionable insights for Amazon sellers, brands, agencies, and investors; revealing hidden opportunities, competitor weaknesses, and the data that actually moves revenue. Make every decision backed by real marketplace signals, not assumptions.
No credit card required • Get set up in under 2 minutes
⭐⭐⭐⭐⭐ Trusted by 2,000+ Sellers