
Kitchen Upgrades and More: Amazon Subcategories Surging in July 2026
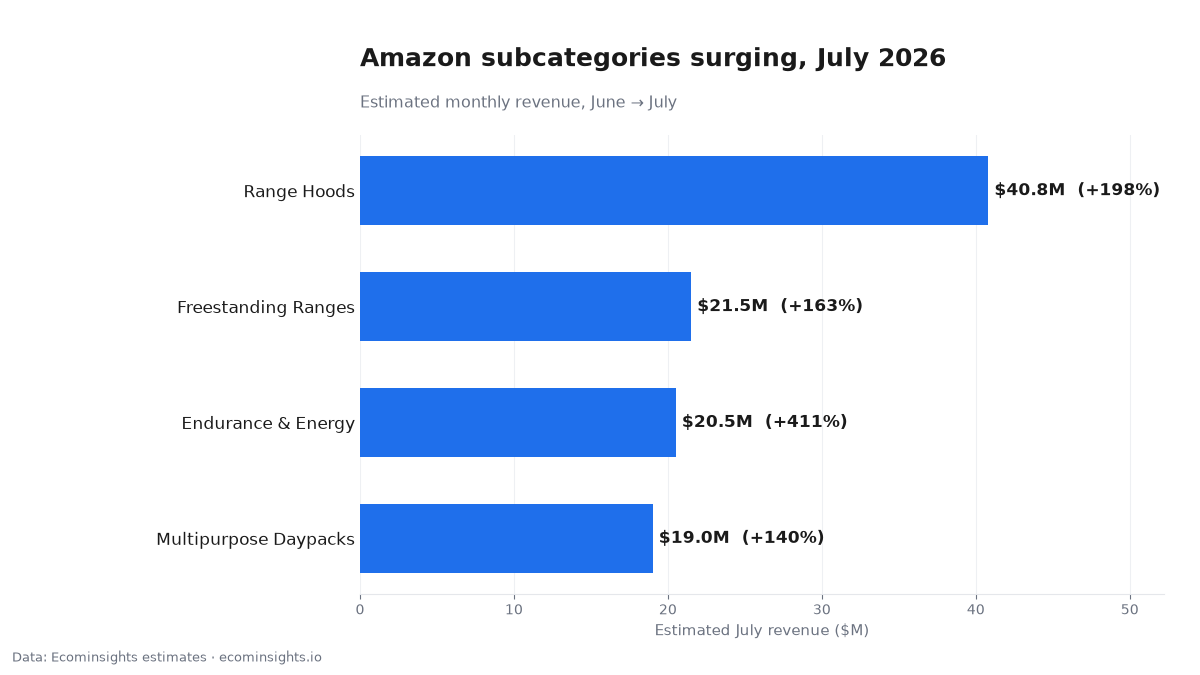
Beyond back-to-school, July 2026’s biggest Amazon subcategory surge was in the kitchen: Range Hoods jumped from an estimated $13.7M to $40.8M (+198%), with Freestanding Ranges close behind at $8.2M → $21.5M (+163%). These are large appliance categories moving on already-sizable bases, which points to a real demand event, a summer wave of kitchen remodels, rather than a data quirk. Below is the full picture, a read of what likely drove each surge, how to tell a genuine category shift from seasonal noise, and what an operator should actually do when the whole pie in their niche is growing. All figures are Ecominsights estimates from observed marketplace signals, comparing June to July 2026.
Key takeaways
- Range Hoods nearly tripled to an estimated $40.8M (+198%).
- Freestanding Ranges grew to $21.5M (+163%), a clear kitchen-remodel signal alongside range hoods.
- Endurance & Energy supplements posted the largest percentage move (+411%) to an estimated $20.5M.
- Multipurpose Daypacks rose 140% to $19.0M: summer travel demand.
- All figures are Ecominsights estimates, not official numbers.
The data at a glance
| Subcategory | Est. revenue (June → July) | Change |
|---|---|---|
| Range Hoods | $13.7M → $40.8M | +198% |
| Freestanding Ranges | $8.2M → $21.5M | +163% |
| Endurance & Energy | $4.0M → $20.5M | +411% |
| Multipurpose Daypacks | $7.9M → $19.0M | +140% |
Why subcategory data matters more than a single product
Watching one product tells you about one listing; watching a subcategory tells you where the whole pie is growing or shrinking. That’s a different and often more valuable signal, because a rising subcategory lifts demand (and ad costs) for everyone in it, whether you’re the leader or a small seller. If your subcategory is surging, the opportunity (and the competition) is expanding around you; if it’s draining, even a well-run listing is swimming upstream. Subcategory trends are the level at which you decide whether to lean into a space, defend your position, or diversify out, which is why they belong in any serious market read, not just a product-by-product view.
The kitchen-remodel signal
The clearest story in the data is a kitchen-renovation wave. Range Hoods (+198%) and Freestanding Ranges (+163%) rising together, both on solid bases, is not two coincidences. It’s two halves of the same purchase. People remodeling a kitchen in summer buy the range and the hood together, so when both surge in the same month, you’re watching a renovation season show up in the marketplace. For anyone selling kitchen appliances, fixtures, or even adjacent categories like cookware and installation hardware, that’s a demand tide worth confirming your inventory and ad coverage caught, and worth planning for again next summer, because remodel seasonality tends to repeat.
Range Hoods: the biggest surge
Range Hoods nearly tripled, from an estimated $13.7M to $40.8M. On a base already in the double-digit millions, a move that large represents a substantial amount of real demand rather than a rounding artifact, the kind of surge that reshapes a subcategory’s competitive dynamics for the month. Expect the leaders in the category to have pulled in outsized revenue, and expect impressions and Buy Box competition to have gotten more expensive as budgets chased the demand. If you compete here, the practical question is whether you had stock and bids in place to capture your share, or whether the wave passed you by while competitors caught it.
Freestanding Ranges: the other half of the remodel
Freestanding Ranges grew to an estimated $21.5M (+163%), moving in lockstep with range hoods and confirming the remodel read. Big-ticket appliances don’t surge on impulse; a jump this size reflects a genuine seasonal wave of buyers making major kitchen purchases together. The lesson for operators isn’t limited to appliance sellers. It’s that correlated subcategory moves tell a richer story than any single one. Two related categories rising together is far stronger evidence of a real demand event than either alone, and spotting those correlations early is where subcategory data earns its keep.
Health and outdoor: energy supplements and daypacks
Two more subcategories round out the surge and both fit the summer calendar. Endurance & Energy supplements posted the largest percentage move on the list, an estimated +411% to $20.5M, consistent with peak summer activity and a broadening interest in functional-health products. Multipurpose Daypacks rose 140% to an estimated $19.0M, a clean travel-and-outdoors signal for the season. Together they show that July’s growth wasn’t confined to the kitchen: summer activity, travel, and wellness all showed up in the data, which is exactly the kind of seasonal breadth you’d expect in midsummer.
A note on very large percentage moves
The Endurance & Energy figure (+411%) deserves a caveat, and it’s the honest kind: very large percentage swings on a subcategory rollup can be amplified by seasonality, by coverage changes in what’s tracked, or by a small prior-month base, and they’re inherently more volatile than a moderate move on a big base. That doesn’t mean the demand isn’t real (the July level of an estimated $20.5M is substantial) but it does mean you should treat the percentage as a flag to investigate rather than a precise measurement. The steadier signals here are the kitchen categories, whose correlated, large-base moves are harder to explain away. Reading estimates well means knowing which numbers to lean on and which to double-check.
Seasonality vs. a structural shift
Most of what’s in this list is seasonal, and that’s useful to know rather than a disappointment. Kitchen remodels, summer activity, and travel all peak now and will normalize later in the year. The way to separate seasonality from a lasting structural shift is to compare the subcategory to the same month last year: a category that jumps every July is seasonal and should be planned for on that cycle; one climbing above its own prior-July level is genuinely expanding and deserves a bigger strategic bet. Treating a predictable seasonal peak as a permanent trend is the most common way operators over-commit inventory and then get stuck with it.
What operators can take from this
Category-level surges tell you where the whole pie is growing. If you sell in kitchen appliances, supplements, or bags, July was a rising tide, worth confirming your stock and ad coverage caught it, and worth pre-positioning for next summer. If you sell elsewhere, the method matters more than these specific categories: track your subcategory’s monthly revenue, watch for correlated moves that signal a real demand event, and use the same-month-last-year comparison to tell seasonal peaks from structural growth. That read tells you when to lean in with budget and when to hold.
How to track your own subcategory
Make it routine. Pull your subcategory’s total estimated revenue for the last twelve months, note its shape and direction, and watch for adjacent subcategories moving with it. Those correlations are early signals of demand shifting toward or away from your space. Each month, tag the move as seasonal or structural and decide one thing: lean in, hold, or diversify. Over a few cycles you’ll have a map of where demand is migrating in your niche, which is the difference between reacting to a surge after it’s priced in and positioning for it in advance.
Why big-base moves are the more reliable signal
When you read a list like this, weight the moves by their base. Range Hoods tripling from an already-large $13.7M is a more trustworthy signal than a huge percentage jump off a tiny starting point, because idiosyncratic noise (a single restock, a coverage change, one big listing) averages out across a large base. That’s the same principle that makes big-brand movement reliable, applied to categories: the numbers you can most confidently act on are meaningful moves on sizable bases, not the flashiest percentages. In practice, this means you should treat the kitchen surge as a firm demand event worth planning around, and the largest-percentage mover as a strong signal you’d still want to confirm before betting inventory on it.
Correlated categories: the pattern worth hunting for
The single most useful skill in reading subcategory data is spotting correlation. One category surging could be many things; two related categories surging together is almost always a real, explainable demand event: here, a kitchen remodel driving ranges and range hoods in lockstep. Train yourself to look for these pairs and clusters in your own space: complementary products that get bought together, categories that share a seasonal driver, adjacent niches that move on the same consumer trend. When you see a cluster move as one, you’ve found a demand wave you can trust and time. When a single category moves alone, treat it as a hypothesis until something corroborates it.
Turning a category surge into adjacent opportunity
A surge in one subcategory often lifts neighbors, and that’s where smaller sellers find room. A kitchen-remodel wave doesn’t only sell ranges and hoods. It pulls demand for cookware, backsplashes, installation hardware, and kitchen accessories along with it. If you can’t compete head-on in a surging big-ticket category, the adjacent, lower-competition products riding the same wave may be the better play. The discipline is to ask, whenever you spot a category surge: what else does this buyer need, and is there a less-contested listing where I can capture part of the same demand? Category data points you to the wave; creativity about adjacencies is how a smaller operator rides it.
Planning inventory around a seasonal peak
The practical payoff of knowing a surge is seasonal is that you can plan for it rather than scramble. If the kitchen and travel categories peak in summer, the time to have stock landed and ad budget ready is late spring, not mid-July, when the wave is already cresting and competitors have bid impressions up. Use last year’s monthly shape to set this year’s reorder and campaign calendar, size inventory to the peak you can actually sell through (not a fantasy of infinite demand), and plan the wind-down so you’re not left holding seasonal stock in the off months. Seasonality is only a trap if it surprises you; anticipated, it’s one of the most plannable advantages in the marketplace.
What to do next
Identify the subcategory you compete in and pull its 12-month estimated revenue trend. Check for correlated neighbors, compare to last year’s same month, and decide whether the current level is a seasonal peak or a real climb. You can track any subcategory’s trend on Ecominsights, free to start.
FAQ
Are these official numbers? No. They’re Ecominsights estimates from observed marketplace signals, June to July 2026, aggregated by subcategory.
Is this surge seasonal? Largely yes. Kitchen remodels, summer activity, and travel all peak now. Expect normalization later in the year; compare to last year’s same month to be sure.
Why did range hoods and ranges both jump? They’re bought together in kitchen remodels, so correlated moves point to a genuine renovation-season demand event.
Should I trust the +411% figure? Treat very large percentage moves on rollups as flags to investigate (they can be amplified by seasonality or a small prior-month base) while noting the July level is still substantial.
Why watch subcategories instead of products? A subcategory shows where the whole pie is growing or shrinking, which affects demand and ad costs for everyone in it, not just one listing.
How do I track a subcategory myself? See any subcategory’s monthly estimated revenue trend on Ecominsights, with 12 months of history.
Methodology: Ecominsights estimates from observed marketplace signals, comparing June and July 2026. Estimates, not official figures. Last updated: October 2026.
Data: Ecominsights, Amazon market intelligence on 5M+ products. Ecominsights.
We deliver the most actionable insights for Amazon sellers, brands, agencies, and investors; revealing hidden opportunities, competitor weaknesses, and the data that actually moves revenue. Make every decision backed by real marketplace signals, not assumptions.
No credit card required • Get set up in under 2 minutes
⭐⭐⭐⭐⭐ Trusted by 2,000+ Sellers