
How to Vet a Brand Before Opening a Wholesale Account on Amazon
Before you open a wholesale account with a brand, confirm three things: it sells consistently every month (not a one-time spike), the Buy Box isn’t already overcrowded with sellers, and the category is stable rather than collapsing. Wholesale ties up cash in inventory and time in a supplier relationship, so a single month’s snapshot isn’t enough to justify either. This guide turns those three checks into a repeatable vetting process (what to measure, what “good” looks like, the red flags that should stop a deal, and a worked example) so you approach brands you can actually make money reselling. All marketplace figures referenced are Ecominsights estimates from observed signals (June–July 2026), useful for direction rather than as official brand numbers.
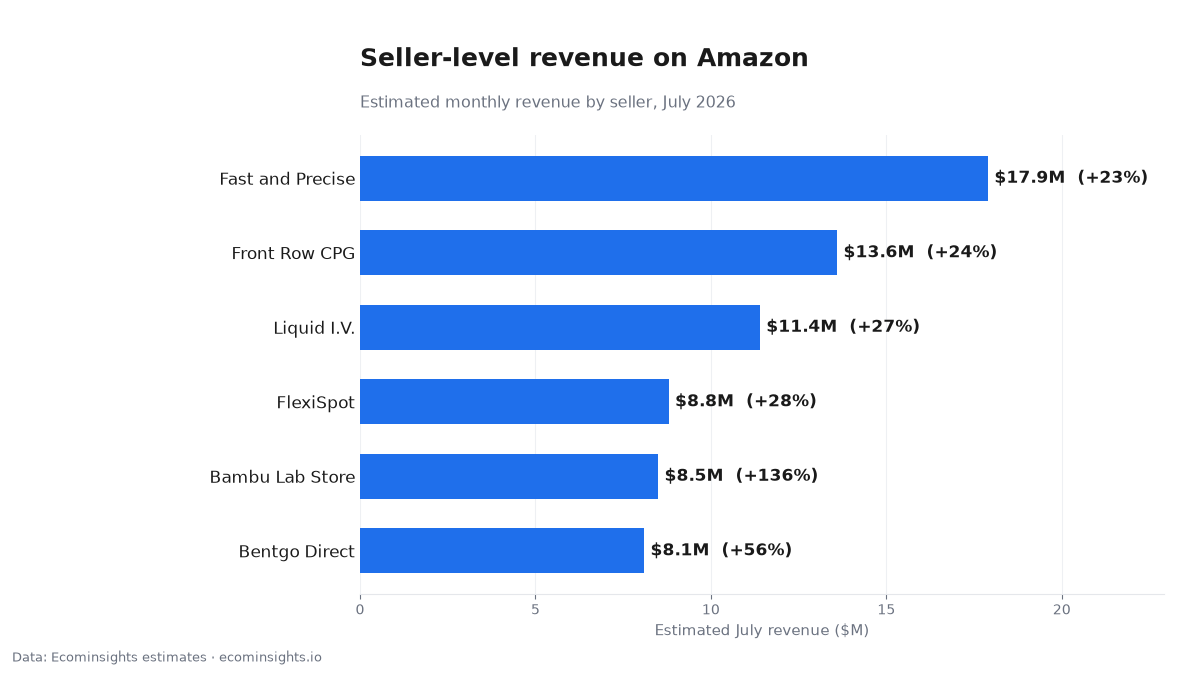
| Seller | Est. revenue, July 2026 | Change from June 2026 |
|---|---|---|
| Fast and Precise (Staples) | $17.9M | +23% |
| Front Row CPG | $13.6M | +24% |
| Liquid I.V. | $11.4M | +27% |
| FlexiSpot | $8.8M | +28% |
| Bambu Lab Store | $8.5M | +136% |
| Bentgo Direct | $8.1M | +56% |
Why wholesale vetting is brand-first, not product-first
Arbitrage and private label start with a product; wholesale starts with a relationship. When you open an account with a brand or distributor, you’re betting that its whole line will sell steadily enough to justify minimum orders, storage, and the working capital locked in inventory. That makes brand-level and seller-level history the right lens, not the single-ASIN demand estimate a product-research tool gives you. The question isn’t “will this one SKU sell?” It’s “is this a brand whose demand is durable, whose margins survive the competition already on the listings, and whose category isn’t quietly shrinking?” Get that framing right and the rest of the process follows.
Check 1: Does it sell every month, not just last month?
The first filter is consistency. Twelve months of brand revenue history tells you whether demand is steady, seasonal, or a one-time spike that’s already fading. A brand that posts reliable revenue across all twelve months is a candidate; one whose entire track record is a single big month (a viral moment, a one-off deal) is a trap. You’ll commit to an order quantity sized for a demand level that no longer exists. Look at the shape, not just the level: gentle seasonality you can plan around is fine, but a lonely spike surrounded by near-zero months is a warning. As a rule of thumb, you want to see demand in at least 9 of the last 12 months before you treat a brand as “consistent.”
What “good” looks like on consistency
Concretely: revenue present every month, a coefficient of variation that isn’t wild, and any dips explained by obvious seasonality rather than a demand cliff. A kitchen brand that sells more in November and December but never disappears is healthy. A brand that did $400K once and $20K every other month is not. That’s a clearance event, not a business you can build a reselling line around. The consistency check alone eliminates a surprising share of “hot” brands that look attractive on a one-month snapshot.
Check 2: How crowded is the Buy Box?
The second filter is competition on the listings themselves. Seller rollups show how many sellers already share a brand’s listings and rotate through the Buy Box. This number decides your margin more than the wholesale price does: on a listing with a dozen sellers, price is the only lever, and it only goes down. Your margin evaporates in a race to the bottom before your first reorder. A listing with a small, stable set of sellers means there’s room to win the Buy Box at a price that leaves you a profit. Count the sellers before you count the margin, because a great cost basis on an overcrowded listing is still a losing deal.
What “good” looks like on Buy Box competition
There’s no universal magic number, but the principle is simple: fewer sellers and a stable count are better than many sellers and a rising count. A brand that gates its distribution (approves a limited number of resellers) is often the sweet spot, enough scarcity to protect margin, enough demand to move volume. If you see the seller count climbing month over month, that’s the listing getting more competitive in real time; assume your margin will be thinner than today’s by the time you’re actually selling.
Check 3: Is the category stable or shrinking?
The third filter zooms out. A brand can look healthy while sitting in a category that’s quietly contracting, and a shrinking category means falling demand and intensifying price competition for everyone in it, including you. Category-level revenue trends over the last 12 months tell you whether you’re opening an account in a growing, flat, or declining space. Growing or stable is fine; a clear downtrend is a reason to either negotiate harder or walk. This check is what keeps you from tying up capital in a brand that’s fine today but riding a category headed the wrong way.
Red flags that should stop a deal
Some patterns should end the conversation regardless of price: a demand history that’s one spike and eleven quiet months; a Buy Box shared by many sellers with the count still rising; a category in clear structural decline; or a brand whose revenue depends almost entirely on a single ASIN (concentration risk: if that listing gets suppressed, your whole account is dead). Any one of these can turn a “cheap” wholesale deal into stranded inventory. Vetting is as much about the deals you decline as the ones you sign.
A worked vetting example
Imagine a kitchenware brand offering you a wholesale account. You pull its history: revenue present in all 12 months with a modest Q4 lift (consistency: pass). Seller rollups show 3–4 sellers on the main listings, flat over six months (Buy Box: pass). The kitchen category is roughly flat to slightly up over the year (category: pass). That’s a green light: all three checks clear, and you can size your first order to the steady monthly demand rather than a spike. Now flip one variable: same brand, but 14 sellers on the listings and climbing. Even with identical demand, that’s a decline-or-negotiate, because the margin math won’t survive the price war. Same data, opposite decision, which is the point of running all three checks together.
How to combine the three signals into a go/no-go
Treat the checks as a gate, not a score: a brand should pass all three to earn an account, because a failure on any one can sink the deal on its own. Consistency protects your order sizing, Buy Box competition protects your margin, and category stability protects your medium-term demand. When a brand passes all three, you approach with confidence and a first order sized to real demand. When it fails one, you either fix the term that’s at risk (negotiate exclusivity to fix the Buy Box, for instance) or move on to the next candidate on your list.
Common wholesale vetting mistakes
The biggest mistake is vetting on a single month. It hides both seasonality and one-off spikes. The second is ignoring the seller count and being seduced by a good cost basis. The third is forgetting the category, so you build a line on a brand that’s fine but shrinking under it. And the fourth is treating estimates as exact: use them to compare candidates and spot direction, framed as “our data suggests,” not to model profit to the dollar. Avoid these four and your vetting will already beat most resellers’.
How wholesale vetting differs from arbitrage and private label
It helps to see why the three checks are specific to wholesale. In retail or online arbitrage, you buy a limited quantity and flip it, so a single strong month can be enough. You’re not committing to ongoing volume. In private label, you own the listing and the Buy Box outright, so seller-count competition on someone else’s listing is irrelevant; your risk is launch demand and differentiation. Wholesale sits in between: you don’t own the listing (so Buy Box competition is central), but you are committing to repeat volume (so consistency is central), and you’re exposed to the category’s health over time (so the category trend matters). The vetting framework changes with the model, and applying an arbitrage mindset (“it sold well last month, buy it”) to a wholesale commitment is how resellers end up with stranded pallets.
Turning the three checks into a scorecard
To keep vetting consistent across many candidates, write the three checks into a simple scorecard you fill in for each brand: months-with-demand out of twelve (target 9+), current seller count and its six-month trend (prefer low and flat), and the category’s 12-month direction (prefer stable-to-up). Add a line for concentration (what share of the brand’s revenue comes from its single top ASIN) because a brand that’s really one listing is a hidden risk. A brand that scores well on all four earns outreach; one that fails any single line goes to a “negotiate or skip” pile. The scorecard turns a gut call into a repeatable filter you can run across a whole prospect list in an afternoon.
Where Ecominsights fits
Brand revenue rollups, seller rollups, and 12-month consistency data answer “is this brand worth opening an account with?” directly, the exact questions product-research tools skip because they’re built around single ASINs. Pair the demand and competition read with your own supplier and distributor research to shortlist who to approach and how hard to negotiate. The tool doesn’t replace relationship-building; it makes sure you’re building relationships with brands worth the capital.
What to do next
Before your next wholesale outreach, run the three checks on every brand on your list: 12-month consistency, Buy Box seller count and trend, and category direction. Rank the ones that pass all three, and approach those first with an order sized to steady demand. You can pull brand revenue history, seller rollups, and category trends on Ecominsights, free to start.
FAQ
Can I see how many sellers share the Buy Box? Yes, seller rollups show how many sellers are on a brand’s listings, which is the single biggest driver of your margin.
How many months of history should I check? Twelve. You want to see steady demand (ideally in at least 9 of 12 months) and understand any seasonality before committing to an order.
Is the sales data official? No. It’s Ecominsights estimates from observed marketplace signals, best used for direction and comparing candidates rather than exact profit modeling.
What’s the biggest red flag? A one-time spike with quiet months around it, or a Buy Box shared by many sellers with the count still rising. Either can strand your inventory.
Does a growing category matter that much? Yes. A shrinking category drags demand and margins down for everyone in it, so category direction is a genuine go/no-go input.
Does it cover 12 months on the free plan? Yes. Monthly history is available on every plan, including the free tier.
Methodology: Ecominsights estimates from observed marketplace signals; brand/seller/category figures aggregate tracked products, June–July 2026. Estimates, not official figures. Last updated: September 2026.
Data: Ecominsights, Amazon market intelligence on 5M+ products. Ecominsights.
We deliver the most actionable insights for Amazon sellers, brands, agencies, and investors; revealing hidden opportunities, competitor weaknesses, and the data that actually moves revenue. Make every decision backed by real marketplace signals, not assumptions.
No credit card required • Get set up in under 2 minutes
⭐⭐⭐⭐⭐ Trusted by 2,000+ Sellers