
Amazon Product Research With a Full Year of Sales History (Free)
The best first product to sell on Amazon has steady, year-round demand, and the only way to see that is a full year of sales history, which you can check for free. New sellers get burned most often by one mistake: picking a product off a single strong month, only to discover it was a holiday spike, not a business. A full year of history is the cheapest insurance against that mistake. This guide explains why seasonality is the trap, how to read twelve months of demand, what “good” looks like for a first product, and how to validate a pick before you spend a dollar on inventory. All figures referenced are Ecominsights estimates from observed marketplace signals (June–July 2026).
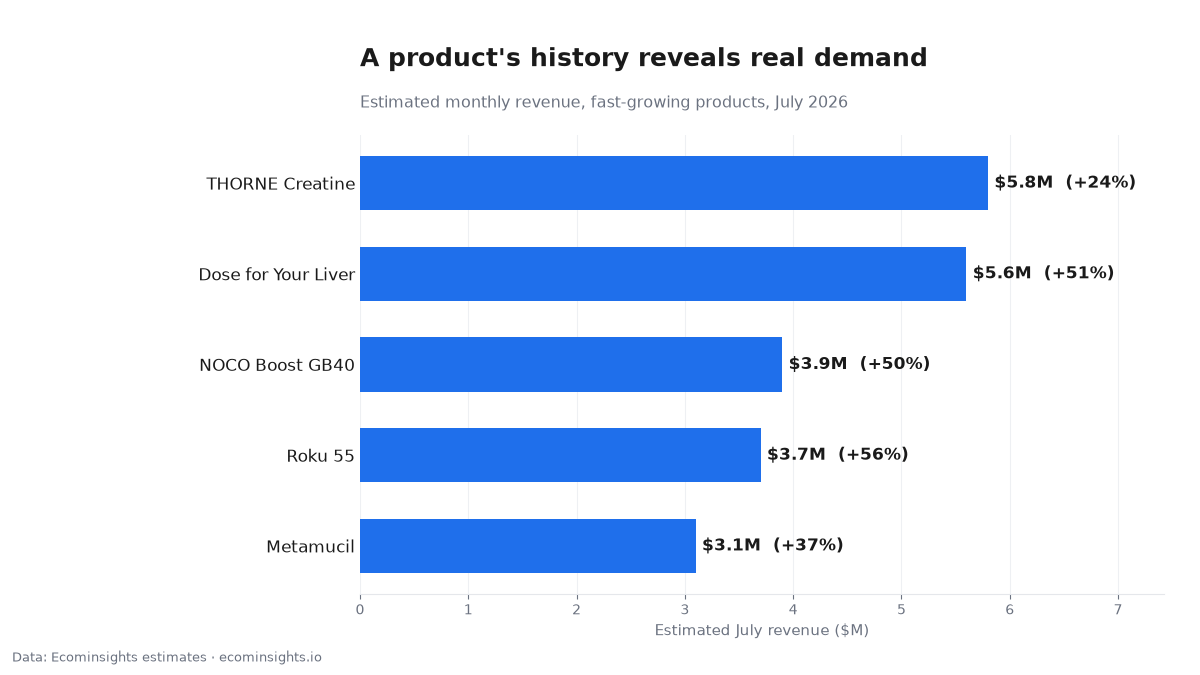
| Product | Est. revenue, July 2026 | Change from June 2026 |
|---|---|---|
| THORNE Creatine | $5.8M | +24% |
| Dose for Your Liver | $5.6M | +51% |
| NOCO Boost GB40 | $3.9M | +50% |
| Roku 55″ Select TV | $3.7M | +56% |
| Metamucil 4-in-1 | $3.1M | +37% |
Why one month of data gets new sellers burned
A single month is the most dangerous amount of data in product research, because it looks like enough and isn’t. A product that did big numbers in December might do almost nothing in February; a July surge might be pure summer seasonality. New sellers routinely find a product with a great-looking recent month, order inventory sized to that month, and then watch demand evaporate as the season turns, leaving cash tied up in stock that won’t move. The one-month snapshot hides exactly the thing that decides whether a product is a business or a blip: whether the demand repeats.
Seasonality is the trap
Twelve months of history shows whether a product sells all year or spikes once, and avoiding one-spike products is the single biggest mistake a full year of data helps you dodge. The pattern is easy to read once you see it: a steady line with a modest seasonal lift is a real, plannable business; a flat line with one tall spike is a holiday or fad event you’ll struggle to time and easily over-order for. As a new seller, your first product should be the boring, steady one: demand you can count on every month beats a bigger number you can only catch once a year.
What “good” looks like for a first product
Aim for three things. First, consistency: demand present in most months, ideally 9+ of the last 12, with any dips explained by obvious seasonality. Second, a manageable competitive picture: enough demand to matter, but not a listing already crowded with dozens of entrenched sellers where price is the only lever. Third, a size that fits your budget: a category big enough to support a meaningful business but not so dominated by giants that a realistic ceiling is tiny. A product that clears all three is a far safer first bet than the flashiest single-month mover.
How to read twelve months of demand
Look at three features of the line. The level tells you how big the opportunity is. The shape tells you the story: steady, seasonal, one-spike, or declining. And the direction tells you whether demand is growing, flat, or fading, which matters because you don’t want to enter a category on its way down. A steady or gently rising line with a base you can afford is the target. A declining line, however big today, is a category you’d be entering late. A single-spike line is the trap to avoid. Reading these three features takes minutes and saves months.
A worked example: two products, same recent month
Imagine two candidates that both did an estimated $120K last month. Product A did roughly that every month for a year, steady, dependable demand. Product B did near-zero for eleven months and $120K once, during the holidays. On a one-month view they look identical; on a twelve-month view they’re opposite bets. Product A is a business you can size inventory for and grow. Product B is a seasonal gamble that will strand your cash for most of the year. This is the entire case for looking at a full year before you buy, and why the free history matters most to exactly the new sellers who can least afford a bad first order.
Why steady beats big for a first product
New sellers are drawn to the biggest numbers, but for a first product, steady demand beats a big spike almost every time. A product that reliably does a moderate amount every month lets you learn the mechanics (sourcing, shipping, pricing, ads) on predictable volume, reorder with confidence, and build cash flow you can forecast. A product that does a huge number once a year forces you to nail inventory timing perfectly on your very first attempt, with no room for the mistakes every new seller makes. The steady product is also easier to fund: you’re sizing orders to an average, not gambling working capital on catching a peak. Boring and dependable is the right ambition for product number one; save the seasonal swings for when you have the experience and capital to time them.
Graduating from free to paid as you scale
The free full-year history is built to get you through validation, confirming a product’s consistency, shape, and direction before you spend. Once you’re actually selling and managing a growing catalog, your needs change: you’ll want deeper competitive tracking, more entities under watch, and the operational tooling for keywords and listing optimization. That’s the natural point to move to a paid plan and add the tools that fit a scaling business. The sequence matters, though: validate the product on free history first, then invest in the machinery to grow it. Paying for tooling before you’ve confirmed the product is a real, repeating business is spending in the wrong order.
Why free history matters when you’re starting
Product-research tools typically gate historical data behind their paid tiers, which is a real barrier when you’re validating your very first product and haven’t earned a dollar yet. Ecominsights includes twelve months of monthly history on the free tier, enough to check a product’s consistency, shape, and direction before you spend anything on inventory or a subscription. For a new seller, that means you can rule out the one-spike traps and confirm steady demand at the exact stage when a wrong pick is most costly, then graduate to a paid plan once you’re scaling and need more depth.
Where Ecominsights fits
Think of it as a free alternative for the historical side of product research, with a full year of sales history built in rather than locked away. You use it to find products with steady demand and a manageable competitive picture, validate the pick against twelve months of data, and then move to paid as your catalog and needs grow. It doesn’t replace the operational tools you’ll eventually add for keywords and listing optimization; it makes sure the product you build all that on is a real, repeating business in the first place.
How to size a category for a first product
Consistency keeps you out of trouble; size tells you whether the opportunity is worth your effort. Pull the category’s total estimated revenue and its 12-month direction, then look at how concentrated it is among the top brands. A category worth a healthy monthly total that’s split across many mid-sized sellers is friendlier to a newcomer than one where two giants own nearly all the revenue and a realistic ceiling for a new entrant is tiny. You’re looking for a space big enough to support a real business, growing or at least stable, and not so dominated that there’s no oxygen left. That read takes minutes with category and brand history and saves you from launching into either a shrinking niche or an unwinnable one.
From validation to launch: a checklist before you buy
Before you place a first inventory order, run a short checklist. One: demand present in at least 9 of the last 12 months (consistency). Two: a steady-to-rising shape, not a single spike (no seasonality trap). Three: a category that’s stable or growing, not declining (you’re not entering late). Four: a competitive picture with room to win the Buy Box, not a listing crowded with entrenched sellers. Five: an order sized to the steady monthly average, not the peak. If a product clears all five, you’re launching on validated demand rather than a hunch, which is the difference between a first product that funds the next one and one that teaches an expensive lesson.
Common first-product mistakes to avoid
Four mistakes sink new sellers repeatedly. Picking off one month (seasonality trap). Chasing the biggest number instead of the steadiest demand. Entering a category that’s already declining because it “looks big.” And ordering inventory sized to a peak month rather than to the steady monthly average. Every one of these is visible (and avoidable) in a full year of history. The discipline of checking twelve months before committing is what separates sellers who build a repeatable business from those who learn the hard way with a garage full of unsold stock.
What to do next
Before you commit to a first product, pull its last twelve months and confirm three things: demand in most months, a steady-to-rising shape, and a category size that fits your budget. Rule out anything that’s one spike and eleven quiet months, and size your first order to the steady monthly average rather than the best month you see. Then use the five-point checklist above as your go/no-go before any money changes hands. You can check any product’s full-year history free on Ecominsights, no spend required to validate your first pick, and the paid plans are there for when you’re ready to scale.
FAQ
Is it really free? Yes, twelve months of monthly history is available on the free plan, which is enough to validate a first product.
Why does a full year matter so much for a first product? Because it’s the only way to tell steady, year-round demand from a one-time seasonal spike, the mistake that burns new sellers most.
How does it compare to other product-research tools? It’s a free alternative for the historical side of research, with a full year of data included rather than gated behind a paid tier; you can add operational tools later as you scale.
What makes a good first product? Steady demand in most months, a manageable competitive picture, and a category size that fits your budget, not the flashiest single-month number.
How much inventory should I order? Size to the steady monthly average, not a peak month, so you don’t strand cash in stock that only moves seasonally.
Are the figures official? No. They’re Ecominsights estimates from observed marketplace signals, best used for spotting demand consistency and direction.
Methodology: Ecominsights estimates from observed marketplace signals; brand/seller/category figures aggregate tracked products, June–July 2026. Estimates, not official figures. Last updated: October 2026.
Data: Ecominsights, Amazon market intelligence on 5M+ products. Ecominsights.
We deliver the most actionable insights for Amazon sellers, brands, agencies, and investors; revealing hidden opportunities, competitor weaknesses, and the data that actually moves revenue. Make every decision backed by real marketplace signals, not assumptions.
No credit card required • Get set up in under 2 minutes
⭐⭐⭐⭐⭐ Trusted by 2,000+ Sellers