
How to Verify an Amazon Brand’s Revenue Before You Buy It
To verify an Amazon brand’s revenue before an acquisition, check 12 months of independent, brand-level sales history against the seller’s claims, and pay as much attention to the trend as to the total. Aggregators, brokers, and search-fund buyers all face the same problem: the seller’s numbers are the seller’s numbers, prepared to make the deal look good. Independent, month-by-month revenue history is how you sanity-check a claim before you write an LOI and long before you spend on formal diligence. This guide covers what to verify, why the trajectory can matter more than the headline figure, the red flags that should reprice or kill a deal, and how the same data sources off-market targets. All figures referenced are Ecominsights estimates from observed marketplace signals (June–July 2026), useful for cross-checking claims rather than as audited numbers.
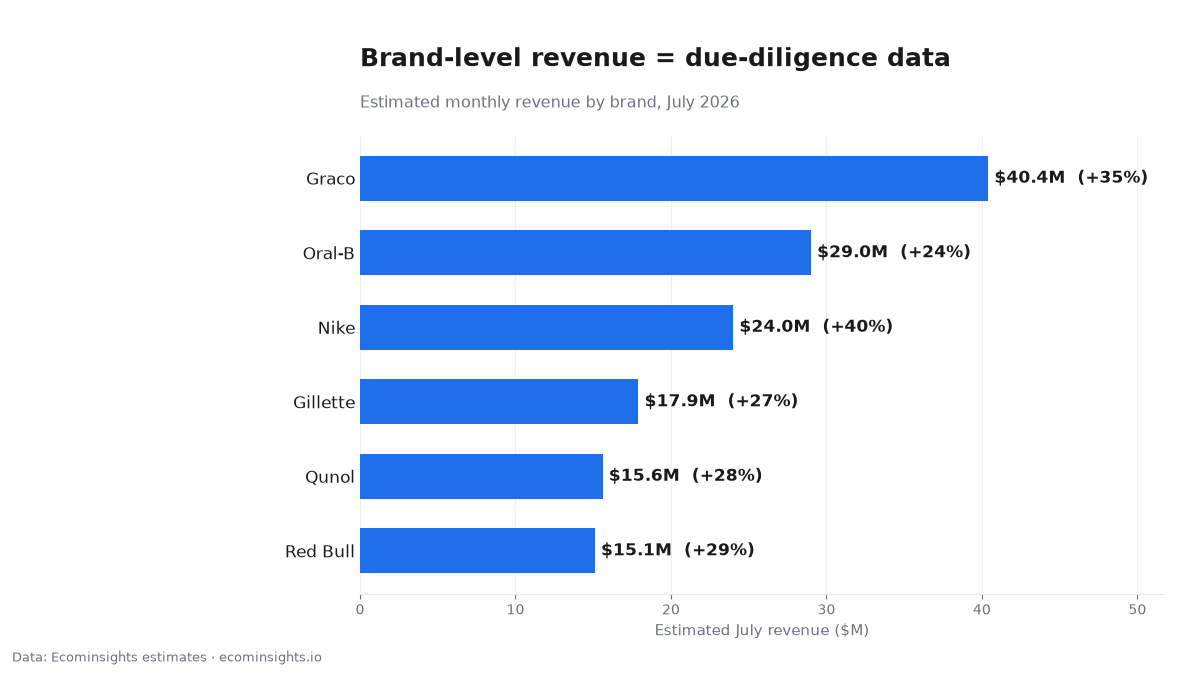
| Brand | Est. revenue, July 2026 | Change from June 2026 |
|---|---|---|
| Graco | $40.4M | +35% |
| Oral-B | $29.0M | +24% |
| Nike | $24.0M | +40% |
| Gillette | $17.9M | +27% |
| Qunol | $15.6M | +28% |
| Red Bull | $15.1M | +29% |
Why the seller’s numbers aren’t enough
Every brand for sale comes with a story, and the P&L is part of the pitch. That doesn’t make it dishonest, but it does make it one-sided: it’s a snapshot chosen and framed by the party who wants the highest price. What it rarely shows clearly is the shape of demand, whether Amazon revenue has been climbing, holding, or quietly sliding over the past year. An independent, month-by-month view of brand-level revenue gives you a second source to hold the seller’s claims against. If the two broadly agree, you gain confidence; if they diverge, you’ve found exactly the question to ask before you commit time and money to a deal that may not be what it looks like.
Trend, not just total
A brand doing an estimated $3M a year that has been declining 20% is a very different asset from one at the same $3M that’s flat or growing, yet a single annual total makes them look identical. Twelve months of history reveals the trajectory a P&L snapshot hides, and trajectory is what you’re really buying: a declining brand is a turnaround bet that should be priced as one, while a flat or growing brand is a more straightforward acquisition. Getting this wrong is how buyers overpay for momentum that has already reversed. The trend line is the single most important thing to establish before you agree on a multiple, because it changes both the price and the plan.
What to verify, concretely
Focus on four things. First, the 12-month brand-level revenue trend: direction and consistency, not just the total. Second, concentration: how much of the revenue depends on a single ASIN, since one suppressed listing can erase the thesis. Third, the seller picture on the key listings: is the brand defending its own Buy Box, or leaking margin to resellers who could vanish or undercut post-sale? Fourth, the category trend around the brand, because a healthy brand in a shrinking category is a different risk profile than one riding a growing space. Those four turn “the revenue checks out” into a real understanding of how durable that revenue is.
Red flags that should reprice or kill a deal
Several patterns should change the terms or end the conversation. A revenue trend that’s declining while the seller’s narrative emphasizes only the annual total. Extreme concentration in one ASIN or one variation, where a single listing issue is an existential risk. A Buy Box increasingly held by third-party sellers, suggesting the brand’s control (and margin) is weaker than claimed. And a category in structural decline, which caps the upside no matter how well the brand is run. None of these necessarily kills a deal, but each is a reason to reprice, restructure, or dig much deeper before signing.
A worked example
Suppose a broker markets a brand at “$3.6M in trailing revenue, strong and stable.” You pull an independent 12-month view and see estimated monthly revenue drifting down over the back half of the year, with most of the total concentrated in one hero ASIN. Nothing here is necessarily disqualifying, but the picture is no longer “strong and stable,” it’s “large but softening and concentrated.” That reframes your offer: a lower multiple, an earn-out tied to stabilizing the trend, and diligence focused squarely on why that hero listing is slipping. Same asset, very different deal, and the difference came entirely from checking the trajectory against the claim before the LOI.
Deal sourcing works the same way
The same data that verifies a target also finds them. The prospecting filter agencies use to build client lists (filter brands by revenue band and growth trajectory) doubles as an off-market deal-sourcing engine. Screen for brands in your target size doing well but perhaps under-optimized, or for sizable brands whose decline signals a motivated seller, and you can build a pipeline of targets before they ever appear on a marketplace or a broker’s roster. Sourcing off-market is where better multiples live, and a data-driven screen gets you there systematically instead of waiting for listings everyone else is already bidding on.
How this fits a diligence workflow
Independent revenue history isn’t a replacement for financial and operational diligence. It’s the fast, cheap first filter that decides which deals earn the expensive work. Use it pre-LOI to sanity-check the seller’s claims and price the trajectory, then let deeper diligence confirm the details on the deals that survive. Because the data covers 12 months and can be exported to fit a deal model, it slots naturally into the front of a workflow: screen, verify the trend, reprice or pass, then commit real diligence resources only where the independent view supports the story. That sequencing saves the most valuable thing in dealmaking, time spent on deals that were never going to close.
How much history is enough for diligence
For verifying an acquisition, twelve months is the practical floor, and here’s why the length is not arbitrary. A full year is the shortest window that lets you separate a genuine trend from seasonality. Without it, a brand that always dips in summer looks like it’s declining, and one that always spikes in Q4 looks like it’s booming, when both are just following the calendar. Twelve months also captures at least one full seasonal cycle of the category, so you can judge the brand against its own normal rather than against a cherry-picked stretch. When a seller shows you a flattering six-month window, the ability to extend the view to a full year is often where the real story (and your negotiating leverage) comes from.
Where Ecominsights fits
Twelve months of independent, brand-level revenue is exactly the kind of data an acquisition needs at the top of the funnel, and export options fit a deal workflow. You verify the trend before you sign and source deals the same way: one dataset serving both sides of the M&A process. It’s framed throughout as estimates from observed marketplace signals, which is precisely its role here: an independent cross-check on the seller’s numbers, not a substitute for audited financials, but a far better starting point than taking the pitch at face value.
Concentration risk: the hidden killer
Of all the things independent data surfaces, concentration is the one buyers most often underweight. A brand whose revenue is spread across many healthy listings is far more robust than one where a single hero ASIN carries most of the total, even if the headline numbers match. That hero listing is a single point of failure: a suspension, a hijacker, a review-bombing, a supply hiccup, or a competitor undercutting it can erase the thesis overnight, and you’d own the downside. Before you value a brand on its total, ask how much of that total would survive losing its top listing. If the answer is “not much,” you’re buying one ASIN with a brand wrapped around it, and the price and structure should reflect that risk.
Post-acquisition: the same data becomes your baseline
The independent history you use to verify a deal keeps working after you close. The trend you bought becomes the baseline you manage against. You can see immediately whether your operational changes are moving revenue, watch for resellers appearing on the listings you now own, and track your share of the category as you invest. For aggregators running a portfolio, the same monthly view across every held brand is a lightweight way to spot which acquisitions are tracking to plan and which need attention, without stitching together each brand’s internal reporting. Verification and portfolio monitoring are the same capability at two points in the deal lifecycle.
Common mistakes buyers make
Three recur. Anchoring on the annual total and ignoring the trend, the mistake that leads to overpaying for a brand already in decline. Underweighting concentration risk, so a single fragile listing turns out to be the whole business. And treating estimates as either gospel or worthless: the right use is directional, as an independent cross-check that flags where the seller’s story and the market data diverge. Buyers who avoid these three price trajectory and risk correctly, and they walk away from the deals that look good only in a carefully chosen snapshot.
What to do next
Before your next LOI, pull an independent 12-month revenue view of the target and hold it against the seller’s claims, checking direction, consistency, and concentration, not just the total. Then run the same screen across your target size to source off-market deals. Do this consistently and you’ll spend your diligence hours on the deals most likely to close on terms that make sense, and walk away early from the ones that look good only in a carefully framed snapshot. You can verify a brand’s trend and build a target list on Ecominsights, with export options for your deal model. Run the same check on every deal, and the trajectory will tell you which targets are worth your diligence hours.
FAQ
Can I verify a target’s revenue trend independently? Yes, 12 months of independent, brand-level estimates you can hold against the seller’s claims.
Why does the trend matter more than the total? Because a declining brand and a growing one can share the same annual total but are very different assets and deserve different prices.
Is there export or API for a deal model? Data export options suit diligence and modeling workflows.
Can I source off-market deals with it? Yes, filter brands by revenue band and growth to build a target list before they hit a marketplace.
What are the biggest red flags? A declining trend hidden behind a headline total, extreme single-ASIN concentration, Buy Box leaking to resellers, and a shrinking category.
Are the figures official? No. They’re Ecominsights estimates from observed marketplace signals, best used to cross-check claims, not as audited financials.
Methodology: Ecominsights estimates from observed marketplace signals; brand/seller/category figures aggregate tracked products, June–July 2026. Estimates, not official figures. Last updated: October 2026.
Data: Ecominsights, Amazon market intelligence on 5M+ products. Ecominsights.
We deliver the most actionable insights for Amazon sellers, brands, agencies, and investors; revealing hidden opportunities, competitor weaknesses, and the data that actually moves revenue. Make every decision backed by real marketplace signals, not assumptions.
No credit card required • Get set up in under 2 minutes
⭐⭐⭐⭐⭐ Trusted by 2,000+ Sellers