
More Brands on the Rise: Amazon’s July 2026 Growers
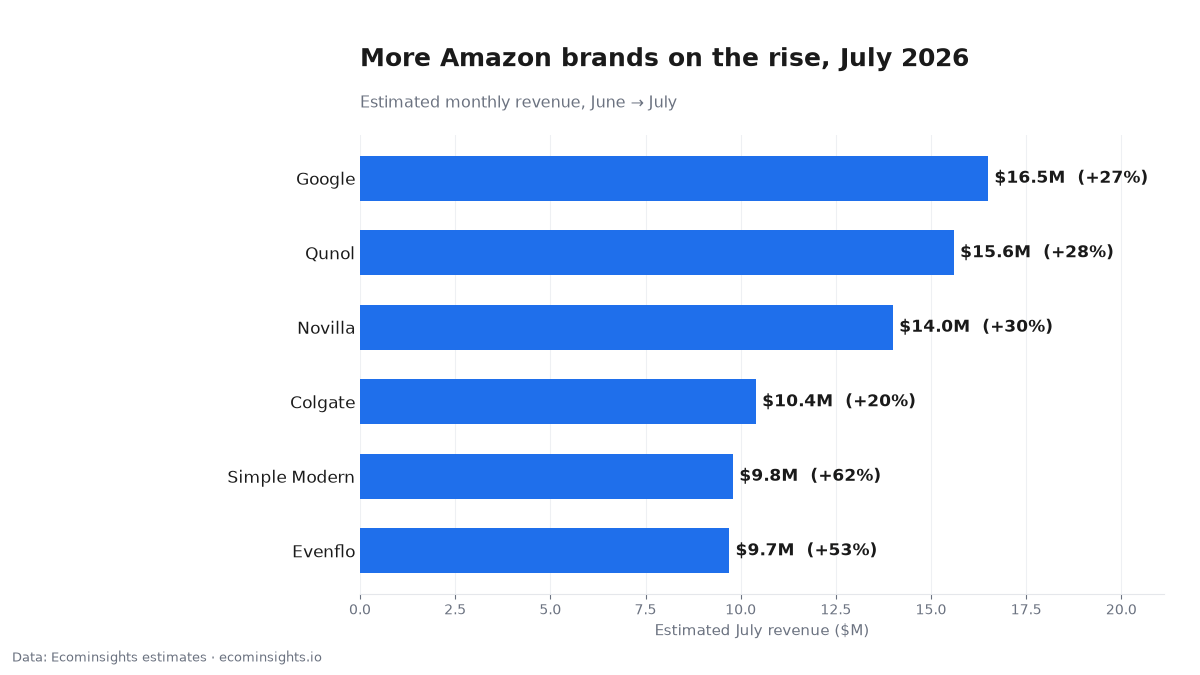
Beyond the biggest movers, a second tier of well-known Amazon brands grew steadily in July 2026: Google reached an estimated $16.5M (+27%), while Simple Modern (+62%) and Evenflo (+53%) posted the sharpest gains in the group. These are large, established brands adding meaningful revenue on already-sizable bases, which is exactly the kind of movement worth watching: big enough to be real demand, spread across enough listings to be reliable. Below is the full list, a read of what likely drove each brand’s move, why this “mid-pack” of growers matters more to most operators than the giants, and how to turn brand-level trends into your own decisions. All figures are Ecominsights estimates from observed marketplace signals, comparing June to July 2026.
Key takeaways
- Google reached an estimated $16.5M (+27%), the largest in this tier.
- Simple Modern (+62%) and Evenflo (+53%) posted the sharpest percentage gains.
- Qunol (+28%) and Novilla (+30%) grew steadily on double-digit-million bases.
- Oral-care and supplement brands keep recurring across the month’s data.
- All figures are Ecominsights estimates, not official brand numbers.
The data at a glance
| Brand | Est. revenue (June → July) | Change |
|---|---|---|
| $13.0M → $16.5M | +27% | |
| Qunol | $12.2M → $15.6M | +28% |
| Novilla | $10.8M → $14.0M | +30% |
| Colgate | $8.7M → $10.4M | +20% |
| Simple Modern | $6.1M → $9.8M | +62% |
| Evenflo | $6.3M → $9.7M | +53% |
Why the mid-pack matters more than the giants
The very biggest brands are interesting, but the second tier is where most operators’ competitive reality actually lives. These are brands you’re more likely to compete with directly, in categories where a mid-sized seller can realistically win share. When a brand in this range grows 50%+, it’s pulling in impressions and Buy Box share you might otherwise have captured, and it’s doing so at a scale you can’t ignore but might be able to respond to. Watching the mid-pack, not just the untouchable giants, is where brand-level data turns into decisions you can actually make about pricing, inventory, and where to spend your ad budget this quarter.
Google: steady growth on a large base
Google grew from an estimated $13.0M to $16.5M (+27%), the largest brand in this tier and a textbook “reliable giant” move: meaningful growth on a big base, spread across a hardware line (streaming devices, smart-home products, phones and accessories) rather than one hero SKU. Growth like this sets the competitive baseline in consumer electronics: it’s the tide that mid-sized accessory and adjacent-product sellers are swimming in. For operators near this space, the read is less “compete with Google” and more “understand that demand and ad competition in these categories rose,” and plan budget accordingly.
Qunol and Novilla: dependable supplement and home demand
Qunol ($12.2M → $15.6M, +28%) and Novilla ($10.8M → $14.0M, +30%) both grew at a steady clip on double-digit-million bases, the kind of dependable, broad-based demand that anchors a category. Qunol’s presence continues July’s recurring supplement theme, while Novilla (sleep and home goods) reflects steady consumer demand in a large, competitive space. Neither is a flashy percentage, and that’s the point: moderate growth on a large base is the most trustworthy signal in this data, because it reflects genuine, diffuse demand rather than a single event. These are the brands setting the pace competitors have to match.
Colgate: the steady staple
Colgate grew an estimated 20% ($8.7M → $10.4M), the most measured move on the list and another entry in the month’s persistent oral-care theme. Staple brands like Colgate rarely post dramatic swings: their demand is habitual and their growth reflects promotional timing and replenishment cycles more than any breakout event. That steadiness is itself useful information: it marks the reliable floor of demand in the category, the baseline against which more volatile competitors rise and fall. When a staple this established still grows 20% in a month, it usually signals a broad promotional or restock cycle lifting the whole category.
Simple Modern and Evenflo: the sharp climbers
The two fastest movers tell a seasonal story. Simple Modern (drinkware) jumped an estimated 62% ($6.1M → $9.8M), fitting peak summer hydration demand and the brand’s strong presence in reusable bottles and tumblers. Evenflo (baby gear) rose 53% ($6.3M → $9.7M), consistent with steady family-buying patterns and possibly a promotional push. Both grew from smaller bases than the giants, so their percentages are naturally more volatile, but both moves are large enough, and in seasonally sensible categories, to read as real demand rather than noise. If you compete in drinkware or baby gear, these are the brands that pulled the category’s demand and ad costs up in July.
The recurring theme: health, home, and seasonal goods
Step back and the composition rhymes with the rest of July’s data: supplements (Qunol), oral care (Colgate), home and sleep (Novilla), seasonal drinkware (Simple Modern), and family goods (Evenflo), with a consumer-electronics giant (Google) on top. That mix isn’t random. It’s the intersection of habitual, repeat-purchase demand and summer seasonality showing up again at the brand level. For anyone deciding where durable Amazon demand lives, a list like this is a map: consumable and household categories for steady compounding, seasonal categories for predictable surges. The brands change month to month; the underlying pattern is remarkably consistent.
How to read brand-level growth (base vs. percentage)
Two brands can both be “up a lot” and mean very different things. Google’s +27% on a $13M base represents far more absolute demand than Simple Modern’s +62% on a $6.1M base, even though the percentage is smaller, and the large-base move is the more reliable trend, because noise averages out across a big catalog. Read this list, and your own category, by weighting moves against their base: the biggest percentages flag brands worth investigating, but the biggest, broadest moves on large bases are the ones you can most confidently plan around. Chasing the flashiest percentage is how operators mistake a small-base wobble for a market shift.
Seasonality vs. momentum
As with every month-over-month read, the discipline is separating the calendar from a genuine shift. Simple Modern’s summer drinkware surge and Evenflo’s family-buying bump are at least partly seasonal and will likely cool; Google, Qunol, and Novilla’s steadier growth on large bases is more likely to persist. The cleanest test is comparing each brand to the same month last year: a brand that jumps every July is seasonal and should be planned for on that cycle, while one climbing above its own prior-July level is genuinely gaining share. Building a strategy on a seasonal peak is the most common way operators over-commit and then get caught with excess inventory.
What operators can take from this
The mid-pack of growing brands is where competitive shifts happen. If a brand in your category is climbing 50%+, that’s pressure on impressions and Buy Box share worth planning around. Check whether your stock and ad coverage can hold your position as demand and costs rise. If you sell in supplements, oral care, home, drinkware, or baby gear, July was a rising tide across several of these brands, and August budgets should reflect it. And whatever your category, watch the second tier as closely as the giants: it’s where the competitors you can actually beat (or lose to) are moving.
What a brand’s catalog breadth tells you
Beyond the headline revenue, how a brand’s sales are spread across its listings is a quiet but useful signal. A brand growing across many ASINs is showing broad, healthy demand that’s hard to knock over; a brand whose growth is concentrated in one or two hero listings is more fragile, however big the total, because a single listing problem can undo it. When you study a competitor in this tier, look past the revenue to the distribution: a broad-based climber is a tougher, more durable rival than a one-listing wonder posting the same number. It also tells you where to compete: a brand leaning on one hero SKU is vulnerable on its long tail, while a broad-based leader has no obvious soft spot.
Using brand trends to time your own promotions
Brand-level trends aren’t only defensive intelligence. They help you time your own moves. If the mid-pack in your category is surging on seasonal demand, that’s usually the most expensive moment to buy impressions, because everyone is bidding into the same wave. Sometimes the smarter play is to promote just ahead of the surge, when demand is building but ad costs haven’t peaked, or just after, when competitors pull back and traffic gets cheaper. Reading when your category’s brands rise and fall lets you position your promotions against the cost curve rather than colliding head-on with every competitor at the peak. The brands’ collective rhythm is, in effect, a calendar for your own spend.
How to build a brand watchlist for your category
Turn this into a monthly habit. Pick the 10–15 brands you genuinely compete with, pull their estimated monthly revenue over the last year, and each month scan for two things: clusters rising together (a demand signal for the whole category) and any single brand breaking away from the pack (a share shift worth studying). Tag each move seasonal, promotional, or structural, and note one response: defend, match, or hold. Over a few cycles the watchlist becomes a living map of where demand and ad pressure are heading in your niche, exactly what these six brands illustrate for household and consumer goods, applied to the categories you actually sell in.
What to do next
Identify the brands you compete with directly and pull their 12-month estimated revenue. Flag anyone growing 50%+, check it against the category and last year’s same month, and decide how to protect your share. You can track any brand’s monthly estimated revenue on Ecominsights, free to start.
FAQ
Are these official figures? No. They’re Ecominsights estimates from observed marketplace signals, June to July 2026, aggregated by brand.
Why focus on big, established brands? Large bases make the signal reliable: a $13M brand growing 27% reflects genuine demand, where a tiny brand’s huge percentage is usually noise.
Why does the mid-pack matter more than the giants? Because these are the brands you’re more likely to compete with directly, in categories where a mid-sized seller can realistically win or lose share.
How much of this is seasonality? Simple Modern (summer drinkware) and Evenflo (family goods) especially; compare to last year’s same month to separate seasonal peaks from real momentum.
Should I worry about a competitor up 50%+? It’s worth planning around (that’s pressure on impressions and Buy Box share) after confirming it’s a real move and not a one-month seasonal spike.
How do I track a brand myself? See any brand’s monthly estimated revenue on Ecominsights, with 12 months of history.
Methodology: Ecominsights estimates from observed marketplace signals, comparing June and July 2026. Estimates, not official figures. Last updated: October 2026.
Data: Ecominsights, Amazon market intelligence on 5M+ products. Ecominsights.
We deliver the most actionable insights for Amazon sellers, brands, agencies, and investors; revealing hidden opportunities, competitor weaknesses, and the data that actually moves revenue. Make every decision backed by real marketplace signals, not assumptions.
No credit card required • Get set up in under 2 minutes
⭐⭐⭐⭐⭐ Trusted by 2,000+ Sellers