
Track Your Amazon Market Share Without an Enterprise Contract
You can track your Amazon market share against competitors month by month without an enterprise platform like Stackline or Profitero: a mid-market brand just needs brand- and seller-level history. Brand managers at manufacturers and distributors face two barriers at once: enterprise tools are priced for large brands and sit well outside a mid-market budget, and ordinary product-research tools don’t answer share or reseller questions at all. That leaves a gap: the exact companies that most need to know their Amazon position are the ones the big platforms price out. This guide explains how to close that gap: what market-share data actually requires, how to catch unauthorized resellers, and how to turn the numbers into reporting leadership will act on. All figures referenced are Ecominsights estimates from observed marketplace signals (June–July 2026).
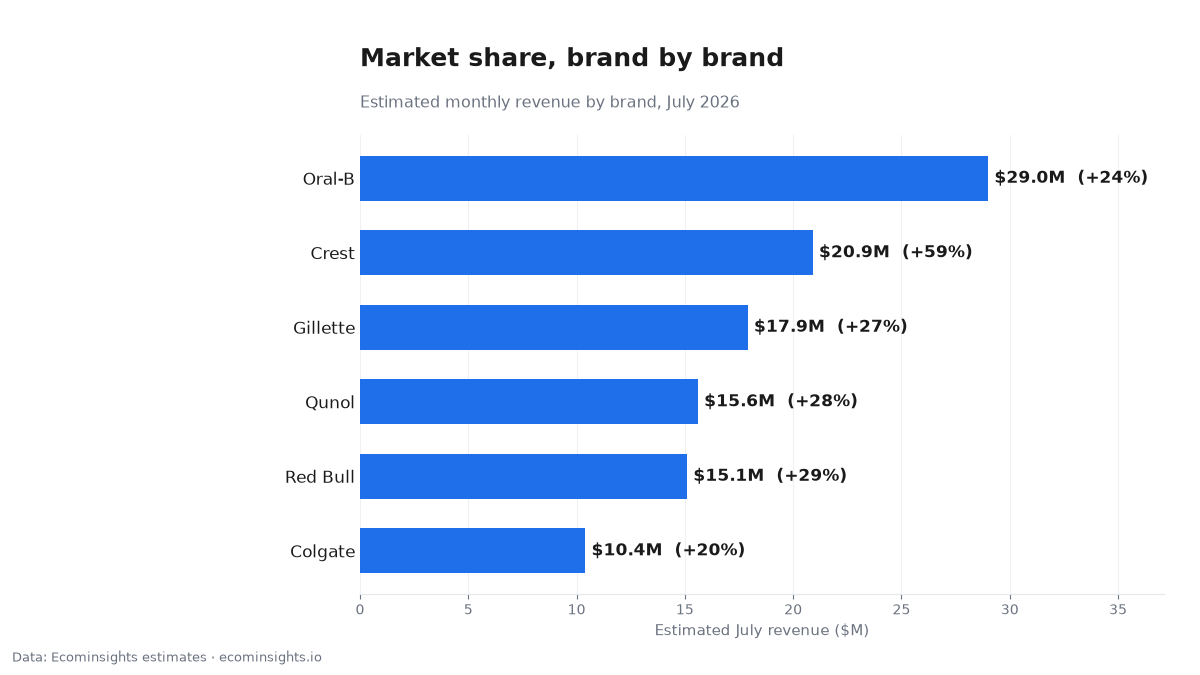
| Brand | Est. revenue, July 2026 | Change from June 2026 |
|---|---|---|
| Oral-B | $29.0M | +24% |
| Crest | $20.9M | +59% |
| Gillette | $17.9M | +27% |
| Qunol | $15.6M | +28% |
| Red Bull | $15.1M | +29% |
| Colgate | $10.4M | +20% |
The mid-market intelligence gap
There’s a real hole in the tooling market. At the top, enterprise platforms deliver share and competitive data but are priced and contracted for large brands. At the bottom, product-research tools are affordable but built around single ASINs. They tell you about a listing, not about your share of a category or who’s reselling your products. Mid-market manufacturers and distributors fall in between: too big for the questions a product tool answers, too small for an enterprise contract. The result is that many brand managers run Amazon partly blind, reporting “Amazon is doing well” without the competitive context to say how well, against whom, or in which direction. Closing that gap is mostly a matter of getting brand-, seller-, and category-level history at a price the mid-market can actually pay.
What market-share tracking actually requires
Market share sounds like an enterprise concept, but the raw material is straightforward: your brand’s estimated revenue over time, the same for your key competitors, and the category total they all sit within. With those three, you can approximate your share and (more importantly) its direction month to month. You don’t need a bespoke enterprise feed to see whether you’re gaining or losing ground against the two or three brands you actually compete with; you need consistent, historical, brand- and category-level estimates. Framed that way, share tracking stops being a luxury and becomes a monthly habit any mid-market brand manager can maintain.
Who is actually selling your products?
One of the most valuable things seller-level data surfaces has nothing to do with competitors. It’s who is selling your own products. Seller rollups reveal every seller on your listings, which is the fastest way to spot unauthorized resellers and channel conflict before they erode your pricing and your brand control. Unauthorized sellers undercut MAP, degrade the buying experience, and complicate your 1P/3P strategy, and they’re notoriously hard to see without seller-level visibility. Catching a new reseller on your listings early (while it’s one account, not ten) is far easier than unwinding an entrenched gray market later. For many brand managers, this reseller visibility alone justifies tracking.
Reporting leadership will actually read
Brand-level history turns “Amazon is doing well” into a defensible competitive report (market share, trajectory, and category shifts) that justifies budget and informs the 1P-versus-3P decision. Leadership responds to position and direction: we hold roughly X% of the category, up from last quarter, while our main competitor slipped is a sentence that wins resources, where “sales are up” is not. The same data supports the strategic calls a brand manager is asked to defend: whether to sell through Amazon directly (1P) or via third parties (3P), where to invest ad budget, and which competitors to worry about. Good reporting isn’t decoration; it’s how the Amazon channel earns the investment it needs internally.
A worked example
Say you manage a mid-market kitchenware brand. You pull your estimated revenue, your two closest competitors’, and the category total over twelve months. The picture: your share has slipped a few points over two quarters while one competitor’s has risen, and the category itself is roughly flat, so this is share you’re losing, not a shrinking market. Seller rollups add a reason: three new resellers appeared on your top listings last quarter, pressuring your Buy Box and price. Now your report writes itself, and so does the plan: address the unauthorized sellers, defend the contested listings, and request the ad budget to reclaim share, all backed by data leadership can see, not just an assertion that things feel competitive.
1P vs. 3P: letting the data inform the call
One of the hardest decisions a manufacturer faces on Amazon is how much to sell first-party (to Amazon as a vendor) versus third-party (through your own or resellers’ accounts). Brand- and seller-level history informs it directly: if resellers are winning your Buy Box and controlling price, a stronger 3P strategy to reclaim control may make sense; if your own listings are healthy and you’d rather not manage the operational load, 1P may be the better fit. The point isn’t that the data decides for you. It’s that you’re making a consequential channel decision with visibility into who actually controls your listings, rather than on instinct.
How to build a monthly share report
Keep it repeatable. Each month, pull your brand’s estimated revenue, your top competitors’, and the category total; compute approximate share and its change; note any new sellers on your listings; and write one or two decisions the numbers support. Track the same metrics over time so the report shows a trend, not just a snapshot. Leadership cares about direction. Over a few cycles this becomes the backbone of your Amazon reporting: a consistent, defensible view of position and momentum that most mid-market brands simply don’t have, produced without an enterprise contract.
Why share, not sales, is the number that matters
The most common reporting failure at mid-market brands is confusing sales growth with progress. Your sales can rise 10% while you’re actually losing ground, if the category grew 20% and competitors captured the difference. Share (your revenue relative to the category and your rivals) is the number that tells the truth, because it accounts for the size of the pie, not just your slice in dollars. A brand manager who reports share and its direction is giving leadership a real read on competitive position; one who reports only sales is describing the weather without saying whether it’s better or worse than everyone else’s. Making share the headline of your reporting is the single biggest upgrade most mid-market Amazon reports can make.
Catching channel conflict before it entrenches
Unauthorized resellers follow a predictable arc: one account appears, wins some Buy Box share on price, others notice the margin and pile in, and within a couple of quarters you have a gray market undercutting your MAP and degrading your control. The cost of catching it early versus late is enormous: a single new seller is a conversation, ten entrenched ones is a project. Monthly seller-level visibility on your own listings is what makes early detection possible: you see the first unfamiliar name when it shows up, not after it’s established. For a brand manager, treating that seller scan as a standing part of the monthly routine is cheap insurance against a problem that’s painful to unwind once it takes hold.
Common mistakes mid-market brand managers make
Three recur. Reporting raw sales without share context, so “up 10%” hides the fact that the category grew 20% and you actually lost ground. Ignoring seller-level data until unauthorized resellers are already entrenched. And assuming competitive intelligence requires an enterprise budget, so they go without it entirely rather than using accessible brand- and category-level history. Avoiding these three means reporting position rather than just sales, watching your own listings for resellers continuously, and accepting that a good-enough estimate available monthly beats a perfect number you can’t afford.
What accessible intelligence changes for a mid-market team
When competitive data stops being an enterprise-only luxury, the way a mid-market brand operates changes. Decisions that used to be made on instinct (which competitor to worry about, whether to push 1P or 3P, where to aim ad budget, when to escalate a reseller problem) get made on evidence instead. Reporting shifts from anecdote to position and trend, which changes how much internal investment the Amazon channel can attract. And the brand manager stops being the person who says “Amazon is doing well” and becomes the one who can say exactly how well, against whom, and in which direction. None of that requires an enterprise contract; it requires consistent brand-, seller-, and category-level history and the habit of looking at it every month.
Where Ecominsights fits
Ecominsights provides brand-, seller-, and category-level Amazon history (market-share direction and reseller visibility) built for the mid-market companies enterprise platforms price out. It’s positioned as accessible competitive intelligence rather than an enterprise contract: the data a brand manager needs to report position, catch channel conflict, and inform the 1P/3P call, at a scale that fits a mid-market budget. Every figure is an estimate from observed marketplace signals, which is the right tool for tracking direction and relative share, the questions that actually drive a brand manager’s decisions.
What to do next
Build one share report this month: your brand, your two closest competitors, the category total, and a check of who’s selling on your listings. Track it monthly so leadership sees direction. Start with the two or three competitors you actually lose sleep over, not the whole category, and expand the view once the monthly habit is established. You can pull brand-, seller-, and category-level history on Ecominsights, mid-market access, no enterprise contract. Repeat it monthly, and you will always know your share, and who is selling on your listings, before either becomes a problem. The brands that treat Amazon as a measured channel, rather than a black box, are the ones that win the internal budget to grow it.
FAQ
Can I see who’s selling my products? Yes, seller rollups show every seller on your listings, which is how you catch unauthorized resellers and channel conflict early.
Do I need an enterprise contract like Stackline or Profitero? No, mid-market brand- and category-level history covers share tracking without an enterprise platform’s pricing and contracts.
How do I track market share without a bespoke feed? Compare your estimated revenue to competitors’ and the category total over time; the direction of your share is what matters most.
Can this inform a 1P vs 3P decision? Yes, seeing who controls your Buy Box and pricing is exactly the input that decision needs.
What should a share report show leadership? Position and direction: your share, its trend, category shifts, and reseller activity, not just raw sales.
Are the figures official? No. They’re Ecominsights estimates from observed marketplace signals, best used for tracking direction and relative share.
Methodology: Ecominsights estimates from observed marketplace signals; brand/seller/category figures aggregate tracked products, June–July 2026. Estimates, not official figures. Last updated: October 2026.
Data: Ecominsights, Amazon market intelligence on 5M+ products. Ecominsights.
We deliver the most actionable insights for Amazon sellers, brands, agencies, and investors; revealing hidden opportunities, competitor weaknesses, and the data that actually moves revenue. Make every decision backed by real marketplace signals, not assumptions.
No credit card required • Get set up in under 2 minutes
⭐⭐⭐⭐⭐ Trusted by 2,000+ Sellers