
The Amazon Sellers Growing Fastest in July 2026
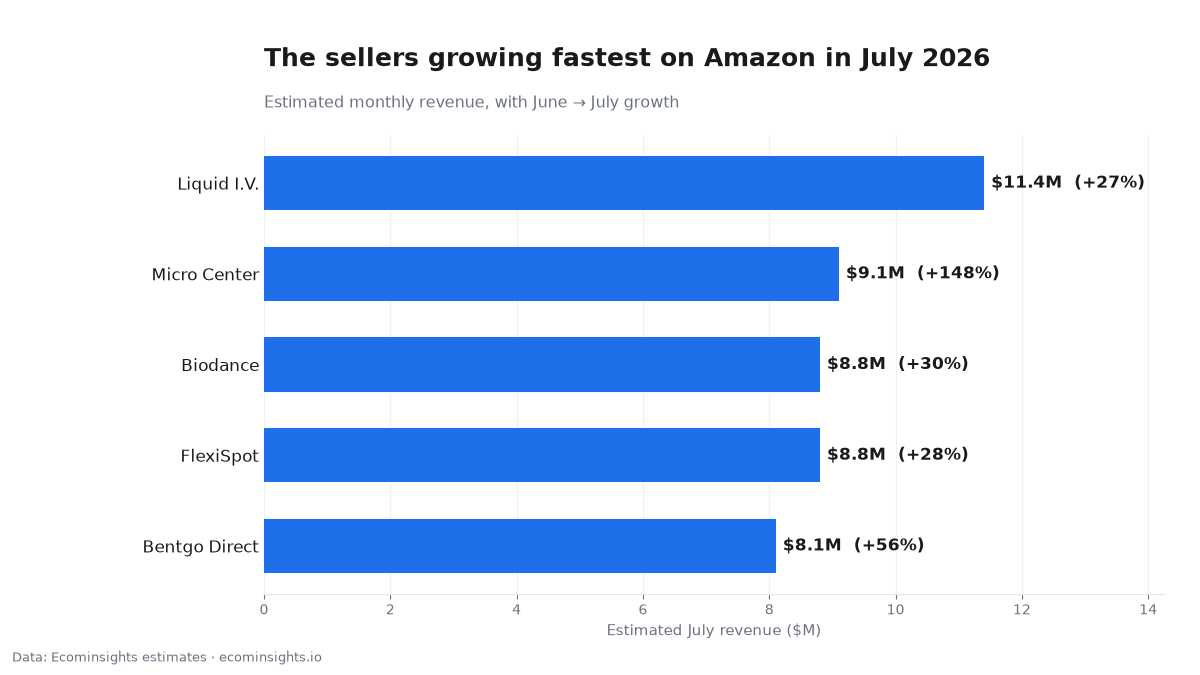
In July 2026, the fastest-growing seller on Amazon by our data was Micro Center (up an estimated 148% month-over-month, from $3.7M to $9.1M) while Liquid I.V. was the biggest fast-grower by revenue at $9.0M → $11.4M. Looking at the buy-box seller behind each sale, rather than the brand on the box, surfaces who is actually capturing demand right now, the number that decides where competitive pressure is coming from. Below is the full list, a read of what likely drove each move, the difference between a brand and a seller in this data, and how to turn seller-level intelligence into a decision. All figures are Ecominsights estimates from observed marketplace signals, comparing June 2026 to July 2026.
Key takeaways
- Micro Center more than doubled: an estimated $3.7M → $9.1M (+148%), the fastest mover.
- Liquid I.V. led by revenue among fast-growers: $9.0M → $11.4M (+27%).
- Bentgo Direct (+56%) and FlexiSpot (+28%) (brands selling direct) both posted strong gains.
- Biodance grew an estimated 30% ($6.8M → $8.8M).
- “Seller” means the buy-box holder; all figures are Ecominsights estimates, not official numbers.
Brand vs. seller: why this list is different
Most “top movers” lists track brands, the name on the product. This one tracks the buy-box seller, the account that actually made the sale. The distinction matters because a single brand’s sales can be split across many sellers (resellers, distributors, the brand’s own storefront), and only the buy-box holder captures the revenue and the margin. Seller-level data answers a question brand data can’t: who is winning the sale right now? If a competitor is climbing the seller rankings across your category, that’s where the pressure on your Buy Box is coming from, information you can’t get by watching brands alone.
The data at a glance
| Seller | Est. revenue (June → July) | Change |
|---|---|---|
| Liquid I.V. | $9.0M → $11.4M | +27% |
| Micro Center | $3.7M → $9.1M | +148% |
| Biodance | $6.8M → $8.8M | +30% |
| FlexiSpot | $6.9M → $8.8M | +28% |
| Bentgo Direct | $5.2M → $8.1M | +56% |
Micro Center: the standout mover
Micro Center grew from an estimated $3.7M to $9.1M, a 148% jump, and by far the fastest on the list. A move that size for an established electronics seller almost never comes from gradual growth; it points to a specific driver, most plausibly high-ticket new-hardware demand (components, prebuilt systems, or a hot product launch) flowing through the marketplace in July. The lesson for operators isn’t the electronics angle specifically. It’s that a triple-digit jump on a multi-million base is a flag to investigate why, because it usually marks a demand event competitors will pile into next. When you see this pattern in your own category, treat it as a signal to check what changed, not just as a leaderboard entry.
Liquid I.V. and Biodance: brands selling direct
Some of the top “sellers” here are brands running their own storefronts and keeping the Buy Box: Liquid I.V. ($9.0M → $11.4M, +27%) and Biodance ($6.8M → $8.8M, +30%). This is the increasingly common direct-to-Amazon model: the brand controls its own listings, wins its own Buy Box, and keeps the reseller margin for itself. For anyone thinking about wholesaling these brands, that’s a critical read: if the brand dominates its own Buy Box, there’s little room for a third-party reseller to compete on the same listings. Seeing the brand as the top seller is exactly the kind of insight that changes a sourcing decision.
Bentgo and FlexiSpot: seasonal and steady growth
The last two tell contrasting stories. Bentgo Direct rose an estimated 56% ($5.2M → $8.1M), a spike consistent with back-to-school lunch-gear demand, a seasonal wave you could see coming a month out. FlexiSpot grew a steadier 28% ($6.9M → $8.8M) across a broad catalog of standing desks and ergonomic gear, the kind of even, multi-ASIN climb that reads as durable demand rather than a seasonal blip. Put side by side, they’re a useful illustration: a sharp, category-timed jump (Bentgo) and a broad, gradual one (FlexiSpot) call for different responses. Ride the wave on one, plan for sustained competition on the other. If you compete near either, the timing of your response should match the shape of their growth: pre-position inventory and bids ahead of a seasonal spike like Bentgo’s, but treat a steady climber like FlexiSpot as a standing competitor whose pressure won’t ease when the season turns.
How to read seller-level revenue
Two cautions make this data more useful. First, a huge percentage jump on a smaller base (Micro Center’s +148%) is more volatile than a moderate jump on a large base (Liquid I.V.’s +27%). Both are interesting, but the big-base move is the more reliable trend. Second, remember that a “seller” can be a reseller, a distributor, or the brand itself; before you draw a conclusion, know which one you’re looking at, because the competitive implication is completely different. Read this way, seller data tells you not just that demand moved, but who pocketed it.
Seasonality vs. a real shift
As with brand data, the trap is mistaking a seasonal bump for a trend. Bentgo’s back-to-school surge will likely cool after the school year starts; FlexiSpot’s broad climb is more likely to persist. The way to tell them apart is the same: check catalog breadth (broad beats narrow), check whether the whole category moved, and compare to the same month last year where you can. A seller that jumps every August is seasonal; one climbing above its own prior-year level is genuinely taking share.
A worked example: reacting to a fast-rising seller
Say you sell standing desks and you notice a seller like FlexiSpot climbing steadily across a broad catalog while your own Buy Box share on overlapping listings has slipped. The seller data gives you the who and the how fast; your next move is to check the how. Pull the overlapping listings and compare price, stock status, and Buy Box ownership. If the rising seller is winning the box on price, you decide whether to match, differentiate, or cede those SKUs and defend the ones where you have an edge. If it’s winning on stock while you’ve been going out of stock, the fix is inventory, not price. The point is that a seller’s climb is a prompt to run a specific diagnosis on your shared listings, not a reason to panic-cut prices across the board.
Building a seller watchlist for your category
Make this a monthly habit. List the top 10–15 sellers competing on your category’s listings and pull their estimated monthly revenue over the last year. Each month, watch for three things: any seller posting a triple-digit jump (a demand event worth investigating), any brand appearing as its own top seller (a signal that reselling room is closing), and any steady climber gaining on your listings (sustained competitive pressure). Tag each as seasonal, direct-brand, or reseller-driven. Over time the watchlist becomes an early-warning system for exactly where your Buy Box is about to get harder to hold, the same read these five sellers illustrate, applied to the accounts you actually compete against.
What operators can take from this
Seller-level data answers what brand data can’t: who is actually capturing the sale. If a competitor is winning the Buy Box across your category and climbing the seller rankings, that’s where the pressure is, and it’s a cue to check your own pricing, stock, and Buy Box share on the overlapping listings. If a brand is its own top seller, that reshapes any wholesale or reselling plan around it. And a triple-digit mover is always worth a closer look, because it often marks a demand event before it’s obvious to everyone else.
Common mistakes reading seller data
Three mistakes recur. The first is chasing the biggest percentage: Micro Center’s +148% is genuinely interesting, but a smaller base makes it more volatile than Liquid I.V.’s steadier +27% on a larger one; the flashy number isn’t always the durable one. The second is confusing a brand-as-seller with an independent reseller: the competitive implication is opposite, so always confirm which you’re looking at before acting. The third is reacting to a single month in isolation. One hot month can be a deal, a stockout recovery, or a seasonal wave, and only the 12-month shape tells you which. Reading seller data well is mostly about resisting these three reflexes and letting the trajectory, the base size, and the seller’s identity inform the conclusion.
How to track a seller in a few minutes
The practical workflow is short. Search the seller, open its estimated monthly revenue trend, and note three things: the level (how big), the trajectory (rising, flat, or cooling), and the breadth (how many ASINs carry the revenue). Then check whether it overlaps your listings and, if so, who currently holds the Buy Box on those SKUs. That five-minute read tells you whether a rising seller is a genuine threat to your sales or just growing in an adjacent lane. Do it for your top competitors once a month and you’ll rarely be surprised by pressure on your Buy Box. You’ll see the climb coming while there’s still time to respond.
What to do next
Identify the top three sellers in your category and pull their monthly estimated revenue for the last year. Tag each move as seasonal, direct-brand, or reseller-driven, and watch for anyone climbing fast against your listings. You can see any seller’s monthly estimated revenue and product list on Ecominsights, free to start. Check back each month so a fast-rising seller shows up on your radar before it shows up in your sales.
FAQ
What does “seller” mean here? The buy-box holder on each listing, aggregated across their tracked products, the account that actually made the sale, which may be a reseller, a distributor, or the brand itself.
Are these official figures? No. They’re Ecominsights estimates from observed marketplace signals, comparing June to July 2026, best used for direction and relative size.
Why track sellers instead of brands? Brand data tells you what’s in demand; seller data tells you who’s capturing it, which is what you need to understand competitive pressure on your own Buy Box.
Is a +148% jump reliable? Treat big-percentage moves on smaller bases as flags to investigate, not settled trends; moderate growth on a large base (like Liquid I.V.) is the steadier signal.
What does it mean when a brand is its own top seller? It controls its own Buy Box and keeps the margin, usually leaving little room for third-party resellers on the same listings.
How can I track a seller myself? See any seller’s monthly estimated revenue and product list on Ecominsights, free to start, with 12 months of history.
Methodology: Ecominsights estimates from observed marketplace signals, June vs July 2026, aggregated by buy-box seller. Estimates, not official figures. Last updated: September 29, 2026.
Data: Ecominsights, Amazon market intelligence on 5M+ products. Ecominsights.
We deliver the most actionable insights for Amazon sellers, brands, agencies, and investors; revealing hidden opportunities, competitor weaknesses, and the data that actually moves revenue. Make every decision backed by real marketplace signals, not assumptions.
No credit card required • Get set up in under 2 minutes
⭐⭐⭐⭐⭐ Trusted by 2,000+ Sellers