
How to Track What Your Amazon Competitors Sell Every Month
To track a competitor’s Amazon sales month by month, watch their brand-level revenue history and category share over a full year, not just where they rank today. Ranking tells you position; it doesn’t tell you volume, direction, or whether a rival’s recent surge is real momentum or a one-off promotion. For an established private-label owner, the difference decides whether you defend a category, extend a line, or hold your budget. This guide lays out exactly what to track, how to read it, and how to fold competitor history into the stack you already run, without an enterprise contract. All figures referenced are Ecominsights estimates from observed marketplace signals (June–July 2026), useful for direction rather than as official numbers.
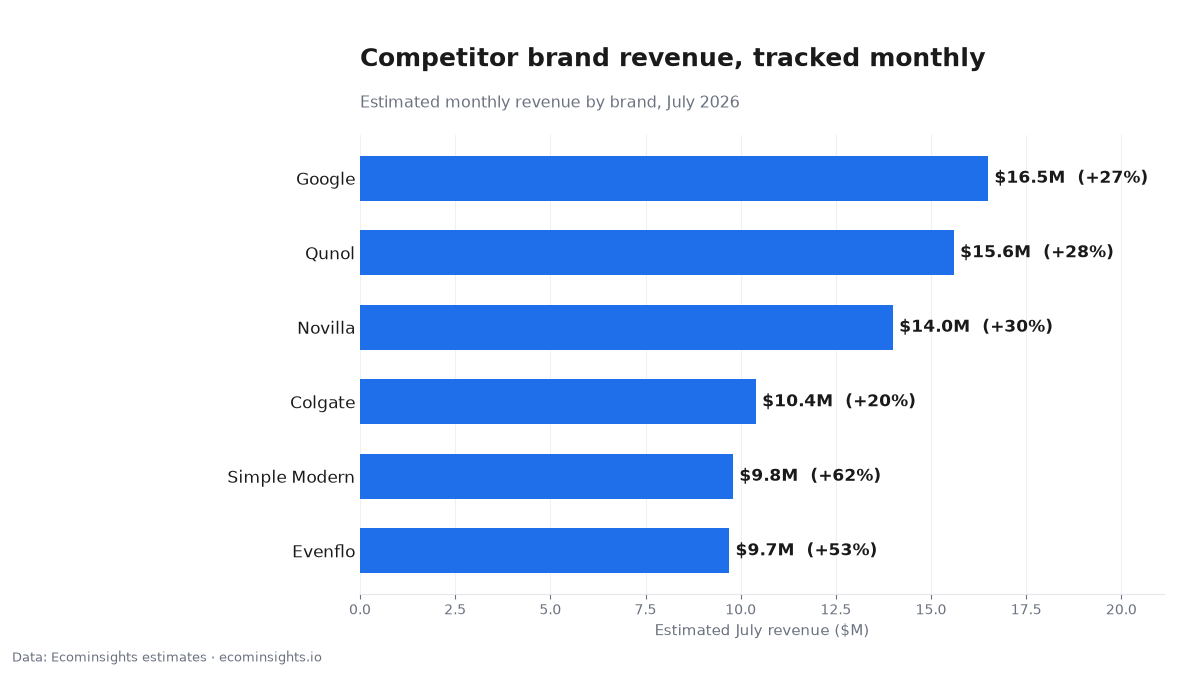
| Brand | Est. revenue, July 2026 | Change from June 2026 |
|---|---|---|
| $16.5M | +27% | |
| Qunol | $15.6M | +28% |
| Novilla | $14.0M | +30% |
| Colgate | $10.4M | +20% |
| Simple Modern | $9.8M | +62% |
| Evenflo | $9.7M | +53% |
Why rank is the wrong metric for competitive intelligence
Best-seller rank is a position, not a quantity. Two competitors can sit one rank apart and be selling wildly different volumes, and a rank can hold steady while the underlying revenue quietly doubles or halves. Rank also says nothing about direction, the single most useful thing to know about a competitor. If all you watch is where a rival ranks today, you’re reading a scoreboard with no score attached. What you actually want is estimated revenue over time: the level (how big), the trajectory (rising, flat, or cooling), and the breadth (how many listings carry it). Those three, tracked monthly, turn “they’re a big competitor” into “they added an estimated 30% over two months, concentrated in one subcategory”, which is something you can act on.
See the whole year, not the snapshot
A single month of competitor data is a photograph; twelve months is the film. Month-by-month revenue reveals the seasonality you can plan inventory around (the predictable Q4 lift, the summer dip) and, just as importantly, it shows whether a rival’s recent jump is durable momentum or a promotional blip that will fade. A competitor who spikes every November is telling you when to have stock and bids ready; one who is climbing steadily above their own prior-year line is taking share and deserves a real response. Without the full year, you can’t tell those two stories apart, and you’ll either overreact to a promo or miss a genuine share shift until it’s expensive to reverse.
Spot category shifts and line-extension openings
Competitive intelligence isn’t only about individual rivals. It’s about where demand is migrating. Watching subcategory revenue share over time flags where the pie is growing and where it’s shrinking, which is the earliest signal for a line extension or a defensive move. If an adjacent subcategory is quietly compounding while yours is flat, that’s a case for extending into it before competitors crowd in. If demand is draining out of a subcategory you depend on, that’s a reason to diversify early. Category-level history is where you see these shifts forming a quarter or two before they show up in your own sales.
What to track, concretely
Keep it to four things per competitor, refreshed monthly. First, brand-level estimated revenue and its 12-month trend. Second, the subcategories where that revenue concentrates, and whether the mix is shifting. Third, the seller picture on their key listings: are they defending their own Buy Box or leaking share to resellers? Fourth, keyword search-volume and CPC trends in your shared categories, so you can time ad spend against the same demand curve they’re riding. Those four, tracked consistently, are enough to brief a competitive review without drowning in dashboards.
How to read a competitor’s trajectory
The shape of the line tells you what’s happening. A steady climb across many listings is genuine, broad-based momentum, the kind that pressures your impressions and Buy Box share, and the kind worth planning around. A single sharp spike on a narrow set of ASINs is usually a promotion or a seasonal wave that will normalize. A sawtooth points to inventory or ad-budget volatility, a competitor who keeps running out of stock, which is an opening for you on the months they’re down. Reading the pattern, not just the latest number, is what separates useful competitive intelligence from anxiety about a leaderboard.
A worked example
Suppose a rival in your supplement subcategory shows estimated revenue climbing from roughly $1.2M to $1.9M over three months, and the growth is spread across a dozen listings rather than one. That breadth tells you it’s real demand, not a single deal. You check the subcategory: it’s growing too, so the whole pie is expanding, meaning there’s room to grow without taking the fight directly to them, if you move on inventory and ads now. Contrast that with the same revenue jump concentrated in one ASIN during a known promo window: there, the right call is to wait for the blip to pass rather than chase it. Same headline number, opposite decision, which is exactly why the detail underneath the trend matters.
Turn the data into a monthly competitive review
Make it a habit, not a fire drill. Once a month, pull your top five competitors’ revenue trends, tag each move as seasonal, promotional, or structural, and note any subcategory where share is shifting. Write down one decision per competitor: defend, extend, or hold. Over a few cycles you’ll have a running record of who’s actually gaining, where demand is going, and which of your responses worked, a discipline most private-label owners never build because their tools only show today’s rank.
Common mistakes tracking competitors
The recurring errors are predictable. Reacting to a single month, chasing a promo spike as if it were a trend. Watching rank instead of revenue, so you miss volume and direction entirely. Ignoring seasonality and mistaking the calendar for momentum. And treating estimates as exact figures rather than directional signals: use them to compare competitors and spot movement, framed as “our data suggests,” not to model a rival’s P&L to the dollar. Avoid these four and your competitive read will already be sharper than most sellers’.
Tracking sellers on a competitor’s listings
Brand revenue tells you how much a competitor is selling; seller data tells you whether they’re keeping it. Watching who holds the Buy Box on a rival’s key listings answers two questions at once: is the brand defending its own listings, and are resellers or hijackers eating into them? A competitor leaking Buy Box share to third parties is quietly weaker than its top-line revenue suggests, and that’s an opening, whether you compete on the same listings or are deciding whether to source that brand. Conversely, a competitor that owns its Buy Box tightly across a broad catalog is a tougher, more disciplined rival than rank alone would tell you. Layering the seller view on top of the revenue trend turns a one-dimensional “they’re big” into a real read on how durable that position is.
Using keyword CPC trends to time ads against a competitor
If a competitor is riding a demand wave, you’re both bidding into the same rising ad costs, and knowing the shape of that curve is an edge. Twelve months of keyword search-volume and CPC trends in your shared categories show when advertising gets expensive and when it eases, so you can decide whether to fight for impressions during a peak or conserve budget and press when costs soften. A competitor pouring spend into a seasonal spike may be overpaying for traffic you can win more cheaply a few weeks earlier or later. Timing your bids against the category’s cost curve, rather than reacting to the rival move by move, is how a smaller budget competes with a bigger one.
How much history is enough
For competitive intelligence, twelve months is the practical minimum, because it’s the shortest window that lets you separate seasonality from a real shift. You need to compare a month to the same month last year, not just to the month before. Anything less and a Q4 lift or a summer dip masquerades as a trend. A full year also lets you see the rhythm of a competitor: when they promote, when they run low on stock, when their category peaks. That rhythm is what makes your responses proactive instead of reactive, which is the entire point of watching competitors in the first place.
Where Ecominsights fits in your stack
Ecominsights is the historical-intelligence layer you add to your existing tools, not a replacement for them: month-by-month competitor revenue, category shifts, and keyword CPC trends to time ad spend, without an enterprise contract. Many owners keep an operations tool like Helium 10 for keyword and listing work and add Ecominsights for the history and competitive view those tools don’t surface. The two answer different questions, and running both is common: one for running your listings, one for reading the market around them.
Offense and defense: what to actually do with the read
Competitive intelligence is only useful if it changes a decision. Broadly, the read points you to one of three moves. Defend, when a rival is climbing on listings that overlap yours: shore up stock, tighten pricing, and protect Buy Box share on the SKUs that matter. Extend, when a subcategory is growing and no competitor has locked it down: move in before it crowds. Or hold, when a competitor’s jump is a promo blip or the category is flat: conserve budget rather than chase noise. Writing the move down each month, per competitor, is what keeps the data from becoming a dashboard you glance at and forget. The number matters only because of the decision it drives.
What to do next
Pick your five closest competitors and pull their 12-month estimated revenue and subcategory mix. Tag this month’s moves, note where demand is shifting, and write one decision per rival. Repeat monthly. You can track competitor revenue history, category shifts, and keyword trends on Ecominsights, free to start.
FAQ
Can I see a competitor’s monthly sales for the year? Yes, 12 months of estimated brand-level revenue, so you can read the trajectory, not just today’s rank.
Do I have to drop Helium 10 or my current tools? No, add Ecominsights as the historical and competitive layer alongside them; they answer different questions.
Why not just watch best-seller rank? Rank is a position, not a volume or a direction: it can hold steady while revenue doubles or halves.
How do I tell a promo spike from real momentum? Check breadth (many listings vs one) and the 12-month shape; broad, sustained growth is momentum, a narrow one-month jump is usually a promo.
Can it help me decide on a line extension? Yes, subcategory revenue-share trends flag where demand is migrating before it’s obvious.
Are the figures official? No. They’re Ecominsights estimates from observed marketplace signals, best used for direction and comparison.
Methodology: Ecominsights estimates from observed marketplace signals; brand/seller/category figures aggregate tracked products, June–July 2026. Estimates, not official figures. Last updated: September 2026.
Data: Ecominsights, Amazon market intelligence on 5M+ products. Ecominsights.
We deliver the most actionable insights for Amazon sellers, brands, agencies, and investors; revealing hidden opportunities, competitor weaknesses, and the data that actually moves revenue. Make every decision backed by real marketplace signals, not assumptions.
No credit card required • Get set up in under 2 minutes
⭐⭐⭐⭐⭐ Trusted by 2,000+ Sellers